Bryan Taylor, Chief Economist, Finaeon
Data Sources
Finaeon has collected data on companies from the Athens stock exchange from 1890 to 1964 to calculate long-run returns for Greece. We collected annual data from 1890 to 1920 including price data, shares outstanding and dividends. Beginning in 1921, we obtained data on individual stocks from the Athens newspaper Εμπρός (Forward). The newspaper provided data on stock prices, but no data on shares outstanding or dividends. The newspaper was published daily, and we collected data on an end-of-month basis from September 1921 to January 1929. In 1929, the Hellenic Statistical Authority (ELSTAT) began publishing a monthly index of the Athens Stock Exchange as well as data on individual banking stocks. The index was calculated until the closure of the exchange in January 1941 after Italy invaded Greece in October 1940. While Greece was occupied first by Italy and then by Germany, the country underwent a hyperinflation. In November 1944 a new drachma was introduced with 1 new Drachma equal to 50 billion old Drachma. A lower level of inflation occurred between 1945 and 1954, and a second drachma was introduced on May 1, 1954, with 1 new drachma equal to 1000 old drachma.
Publication of Εμπρός was suspended during World War II and publication of data from the Athens Stock Exchange began again on February 21, 1945. Prices were quoted in the new drachma. Although 1 new drachma was equal to 50 billion old drachma, there was little difference between the prices of securities in February 1945 and January 1941. Consequently, we were able to make a small adjustment in the index to reflect the nominal difference between the 1941 and 1945 prices.
We collected monthly data from February 1945 to July 1954 when the prices of stocks were reduced by a factor of 1000 to reflect the introduction of the new drachma. The ELSTAT index was discontinued during World War I and was restarted in July 1954. The ELSTAT publications provided end-of-month stock prices as well as information on shares outstanding and stock splits, but no dividend data. The Monthly Statistical Bulletin published both indices for the different sectors and data for banks from 1929 to 1941 and for stocks from multiple sectors from July 1954 to December 1964. The monthly indices were calculated until September 1988 and daily data for the Athens Stock Exchange began on October 3, 1988. We lack dividend data before 1977, so between 1890 and 1976, we were only able to calculate a price index for Athens. Return data begins in December 1976.
Data on the Greek Central Bank Discount rate is available beginning in 1841 and continues until 1960 when 3-month time deposits are used to 1980, 3-month ATHIBOR to 1993 and 3-month Treasury bills beginning in 1994. This enables us to provide a cash index for Greece from February 1841 to the present.
A History of Greek Defaults
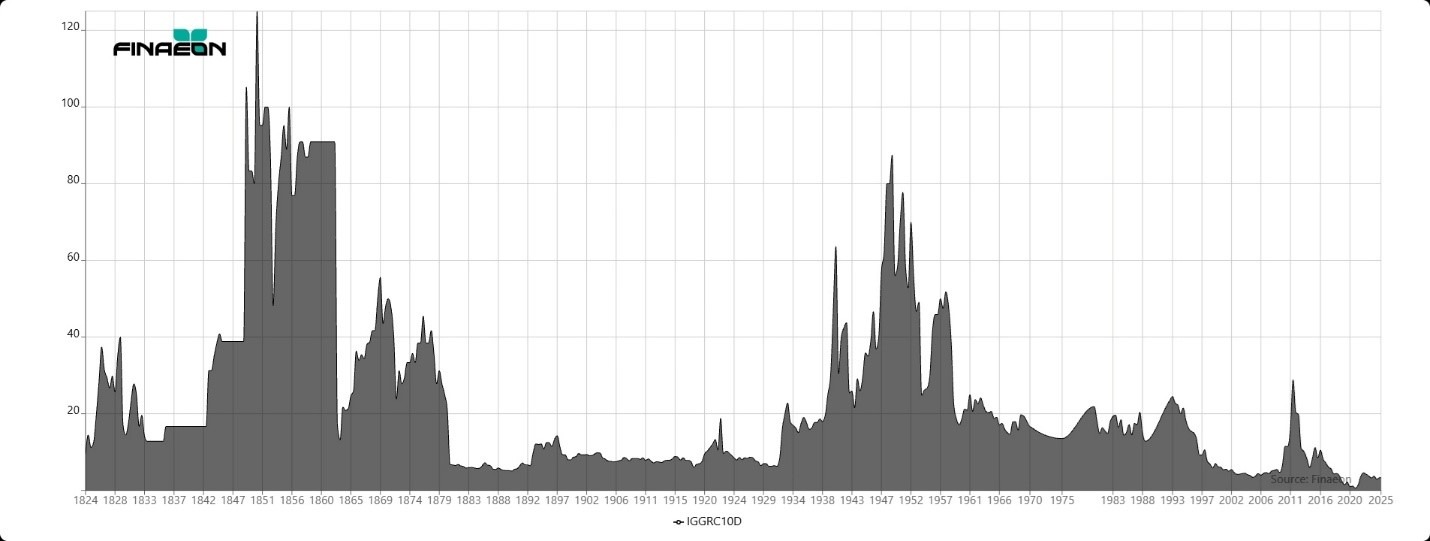
Since we have no data on Greek equities during the 1800s, it is useful to look at Greek government bonds. Greece issued its first bonds during its War for Independence in the 1820s. The Greek rebellion began on March 17, 1821, and was suppressed by the Ottoman Empire in 1825. Russia, the United Kingdom and France came to the aid Greece in 1827, which led to military success in 1828 and independence in May 1832.
On February 21, 1824, Greece issued £800,000 in 5% bonds at £59 in London and on February 15, 1825, Greece issued £2,000,000 in bonds at £56.50 in London. The riskiness of the bonds was obvious since at issue, the 1825 bond was already yielding 8.85% when British consols were yielding 3.2%. The price of the bonds followed the fortunes of independence, and as the Ottoman Empire suppressed the Greek revolt, the prices of the bonds fell quickly.
The 1824 bonds paid five coupons through July 1, 1826, and the 1825 bonds paid 4 coupons through January 1, 1827. When Greece formally defaulted on the bonds in July 1827, the price of the bonds dropped to 10.50, a fall of 82% from the original issue price in 1825. The price of Greek bonds followed the fortunes of the War for Independence and went as high as 54 in April 1830 but quickly fell when it became obvious the newly independent Greece could not honor its debts.
Greece remained in default on these bonds until 1878. As part of one restructuring in 1846, the Greeks detached the coupons due between 1827 and 1846, amounting to £95, from the original bonds and the detached coupons traded separately from the original bonds. By the time the Greeks finally restructured their defaulted debt in October 1878, the 1824 bonds were £275 behind in principal (£100) and interest and the 1825 bonds were £265 behind in principal (£100) and interest. The holders of the 1824 loan received £31 12s. for every £100 nominal of the old bonds, the 1825 bondholders at the rate of £30 10s. for every £100, and the holders of detached coupons £11 12s. for every £100.
The most fascinating part of this saga is that Greece was able to issue new bonds while in default. After Greece gained its independence, Otto of Bavaria was placed on Greece’s throne by England, France and Russia. The three Allied Powers agreed to guarantee a £2,100,000 loan for Greece, of which £550,000 went to the Ottoman Empire for territory it ceded to Greece. Holders of the 1824 and 1825 debt voiced their complaints about their subordination to the new bondholders to Lord Palmerston, the British secretary of state for foreign affairs, but to no avail.
Greece issued £2,343,750 in bonds that were jointly guaranteed by England, France and Russia, with each country guaranteeing £781,250 of the loan. The bonds traded separately from each other outside the London Stock Exchange since Greece was still in default. All the revenues of Greece were hypothecated as security for the payment of the loans, and a sinking fund was to be established, but Greece discharged only a very small portion of the loan.
The interest and principal were paid by the three Allied Powers until the loans were all discharged in 1871. The cost to the three governments of this guarantee was £3,222,671 in principal and interest which Greece never paid. Having settled their outstanding loans in 1878, Greece obtained loans from bankers in London and Paris in 1879 and was able to issue a new 5% bond in London in 1881, only to default on this and other newly issued bonds in 1893. Greece avoided another default between 1893 and 1931 but defaulted once again in 1932.
Greece ran deficits in the 1800s and 1900s because it was continually involved in wars: the wars of independence in the 1820s, two wars with the Ottoman Empire in 1897 and 1919, two Balkan wars in the 1910s, two World Wars and a Civil war in the late 1940s. During the 1980s and 1990s, Greek government debt was equal to Greece’s GDP. Greece was unprepared for the Great Recession of 2007-2009 and Greece required bailout loans in 2010, 2012 and 2015. Because of the economic problems Greece was facing, MSCI downgraded Greece from being a developed market to an emerging market in 2013. Since then, Greece has stabilized its economy. Greek bond yields fell below 1% in 2020 and are currently comparable to French bond yields.
Greek bond yields from 1821 to 2025 are provided in Figure 1. You can assume that whenever the bond yield was over 10%, which was most of the time, that Greece was in default and was not paying interest or principal on its bonds. Yields are for foreign bonds through 1980 and domestic bonds since 1980. Except for the defaults between 2010 and 2015, government bond yields have remained relatively low during the twenty-first century.
Figure 1. Greek Bond Yields, 1821 to 2025
The Athens Stock Exchange
The Athens stock exchange was founded in 1876. Banking has represented over half of the market capitalization for Greek stocks since the 1890s. Today, the capitalization of the Greek stock market remains small at about $100 billion with around 166 companies listed on the exchange. By comparison, in the United States there are 100 companies whose market cap is greater than the Athens Stock Exchange. Two Greek banks currently have a market cap over $10 billion, but most Greek companies have a market cap of less than $1 billion. Greece has never had a successful international company, and as mentioned above, Greece is now classified as an emerging market by MSCI.
Figure 2. Greek Stock Market Index, 1890 to 2025
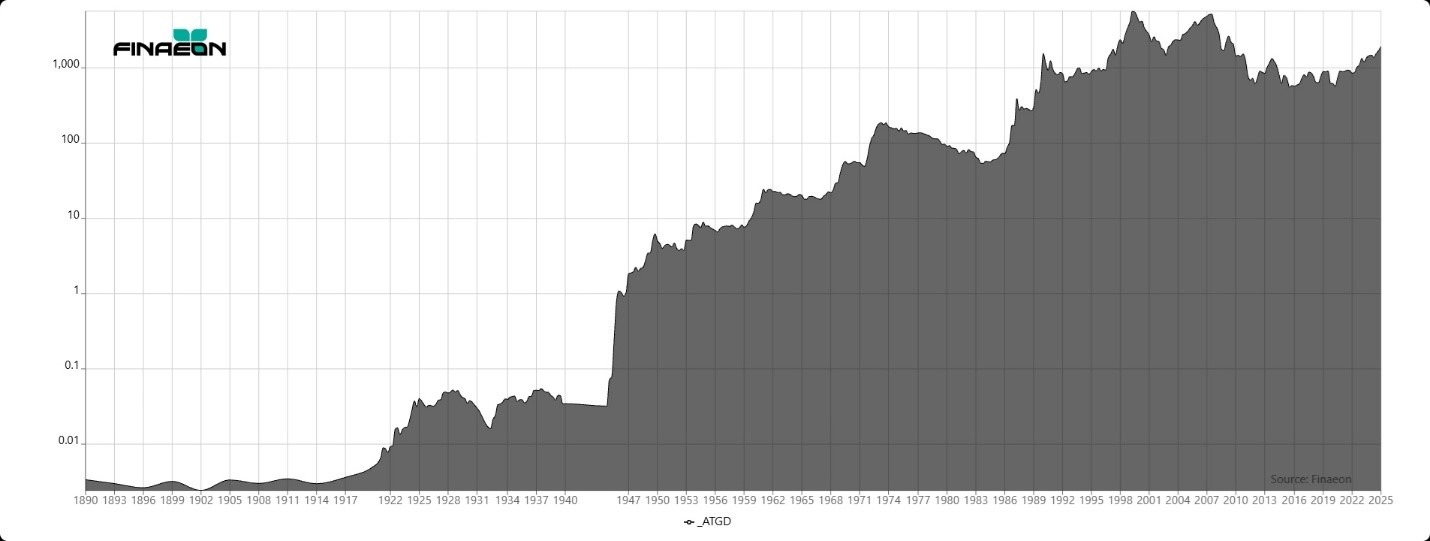
Figure 2 shows the performance of the Greek stock market between 1890 and 2025. There was little change in the price of Greek stocks before World War I. Banks represented over half of the market capitalization and railroads were the second largest sector. The Greek stock market in inflation-adjusted Greek Drachma before World War II is provided in Figure 3. After World War I ended, Greece suffered from inflation which drove the stock market down to a bottom in 1922. The economy and the stock market rallied for the next three years, hitting a peak in 1924. The market kept up with inflation until 1928 when the Greek stock market crashed, declining by almost 70% by 1932. The Athens Stock Exchange closed on September 20, 1931, following closures in other European countries after the collapse of the Creditanstalt bank in Austria. The market didn’t reopen until December 1932. Greek stocks recovered during the next two years and peaked in 1934.
Figure 3. Greek Stock Market Index After Inflation 1914 to 1941
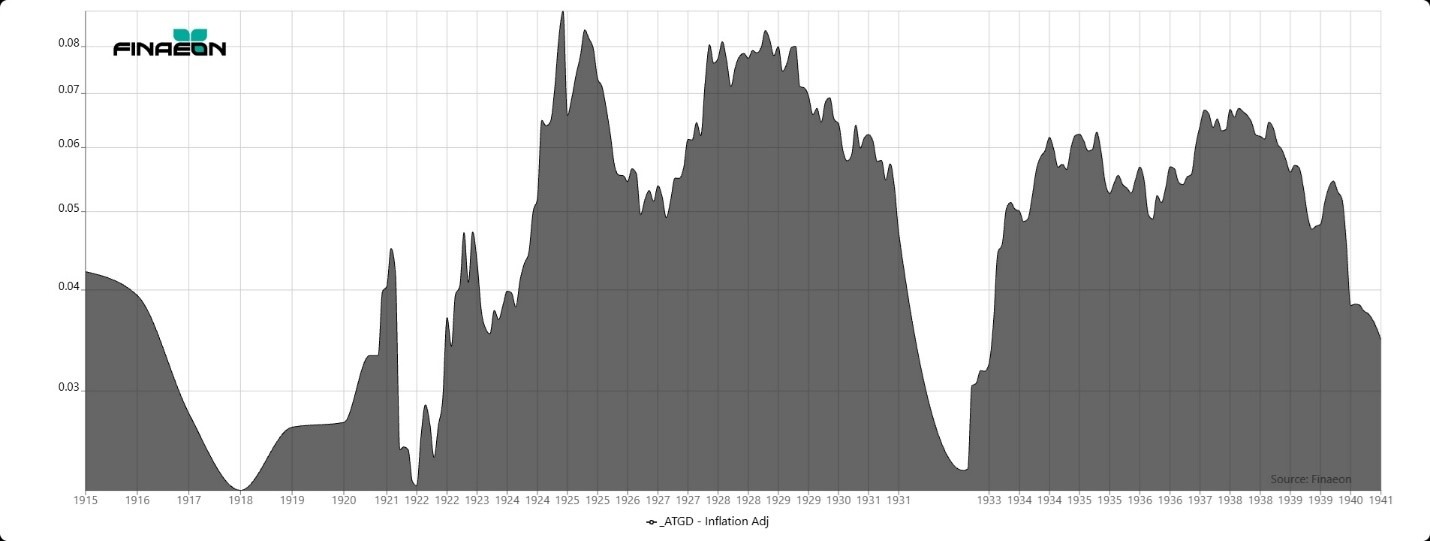
The Italian army invaded Greece on October 28, 1940, but the Greeks were able to push the Italians back into Albania. The Athens Stock Exchange closed in January 1941. On April 6, 1941, Germany came to the aid of Italy and invaded Greece, conquering the country in a month. Greece was liberated in October 1944, but a civil war followed which lasted until 1949. Greece suffered hyperinflation during 1944 and in November 1944, a new drachma replaced the old drachma at the rate of 50 billion old drachma to one new drachma. Inflation continued during the civil war, and on May 1, 1954, a second drachma was introduced, replacing the old drachma at the rate of 1000 old drachma for one new drachma. Because of the hyperinflation during World War II, it is not possible to compare the returns before and after World War II directly, so those two periods are treated separately.
The Greek stock market performed well after World War II, rising steadily between 1945 and 1973 as can be seen in Figure 4. Greece was thrown into turmoil in July 1974 when Turkey invaded Cyprus and the dictatorship collapsed, leading to a revival of democracy in Greece. The stock market steadily declined between 1973 and 1984. Since then, the Greek stock market has made little overall progress, hitting peaks in 1989, 1999 and 2007 before collapsing when the Greek debt crisis hit in 2010. The Greek stock market declined by over 70% following each of the bull market peaks in 1999, 2007 and 2009. The market made no progress in the 2010s as Greece worked to stabilize its economy, but the stock market has begun moving up once again in the 2020s signaling that stability has returned to the Greek economy. Nevertheless, after adjusting for inflation, the Athens stock exchange price index in 2025 is at the same level it was at in 1961. Share prices have kept up with inflation, not beat it.
Figure 4. Greek Stock Market Index After Inflation, 1945 to 2025
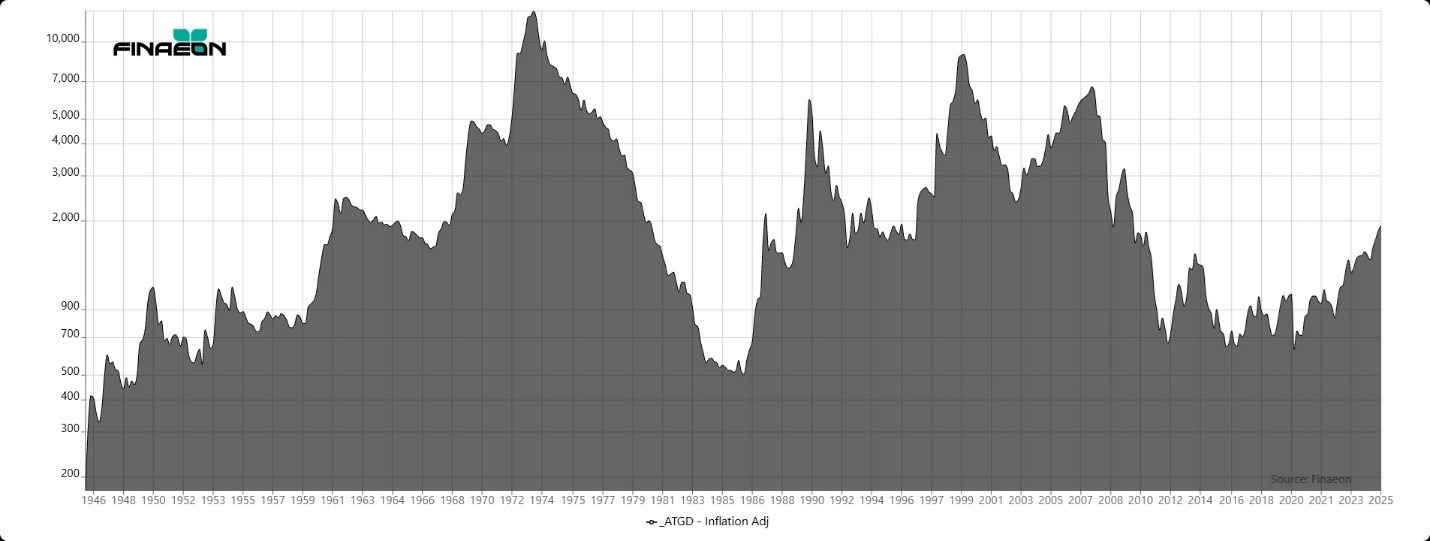
Table 1. Returns by Decade to the Greek Stock Price Index in Real USD
| Decade | Annual Return | Decade | Annual Return |
| 1889-1899 | -0.58 | 1969-1979 | -3.22 |
| 1899-1909 | -3.25 | 1979-1989 | -4 |
| 1909-1919 | -5.12 | 1989-1999 | 15.78 |
| 1919-1929 | -0.75 | 1999-2009 | -8.18 |
| 1929-1939 | -4.44 | 2009-2019 | -12.12 |
| 1949-1959 | -3.95 | 2019-2024 | 4.4 |
| 1959-1969 | 16.7 |
Returns to the Athens Stock Exchange by decade is provided in Table 1. Data have been converted into US Dollars and do not include dividends. During most decades, returns were negative. The only two decades in which investors received a positive return in real US Dollars before dividends were the 1950s and 1990s, both of which provided double-digit returns. So far, returns are positive for the Greek stock market during the 2020s, but the end of the decade is still five years out. Every other decade had a negative return before dividends. If you assume a 5% annual dividend, then most decades up until the 1980s would have provided a positive return, but the returns would be small, especially compared to other countries.
Bull and Bear Markets
The course of bull and bear markets in Greece is charted in Table 2. In most cases, specific events caused the bear markets that occurred in Greece. The 1923 bear market is linked to the Corfu Incident in which an Italian general was murdered on Greek territory causing Mussolini to occupy the island of Corfu. The crisis was resolved when the League of Nations’ Conference of Ambassadors rendered an opinion in Italy’s favor.
Greece suffered a coup d’etat on June 25, 1925, after which General Theodore Pangalos became dictator in Greece. This was followed by a brief war between Greece and Bulgaria in October 1925. The decline between 1928 and 1932 was caused by the Great Depression which led to the closure of the Athens Stock Exchange on September 20, 1931. The exchange reopened in December 1932 leading to a bull market into 1938.
The Athens stock exchange closed during World War II while the country was occupied by Germany. The market recovered after the war showing a steady rise between 1945 and 1973 with minor setbacks along the way. Greece went through a turbulent period between July 20 and July 24, 1974, when Turkey invaded Cyprus, the seven-year long military junta collapsed, and a new Hellenic Republic was born, restoring democracy to Greece. This was followed by the difficulty of adjusting to the politics of the revived democracy and the global recession of the 1970s. The Greek stock market declined by over 73% between 1973 and 1984.
Greece’s stock market declined along with global stock markets in 1990, 1999, and 2007, falling by over 50% in each of those bear markets. These declines prevented the Greek stock market from making any overall progress. The worst decline occurred when Greece defaulted on its debts between 2010 and 2015. The stock market declined by over 83% between 2009 and 2012, and by over 67% between 2014 and 2016. Many analysts wondered whether Greece would have to break its link to the Euro after its defaults and reintroduce the Drachma as its currency, but so far Greece has been able to avoid that fate.
The international community came to Greece’s rescue between 2010 and 2015, and Greece was willing to introduce the necessary reforms to recover from its excessive debts. During the 2020s, fears of Greece’s default have subsided, government bond yields have declined, and today Greek bonds pay yields similar to French government bonds. The stock market has steadily recovered since the Athens Stock Exchange hit its lows during the Covid pandemic in 2020.
Table 2. Greek Bull and Bear Equity Markets, 1891 to 2025
| Bottom | Bear Decline | Top | Bull Rise |
| 12/31/1891 | |||
| 12/31/1902 | -30.59 | 4/30/1923 | 744.39 |
| 8/31/1923 | -34.62 | 3/31/1925 | 207.44 |
| 9/30/1926 | -27.92 | 4/30/1928 | 74.32 |
| 12/31/1932 | -69.61 | 2/28/1938 | 248.32 |
| 8/31/1940 | -37.59 | ||
| 2/28/1945 | 2/28/1950 | 18598.07 | |
| 12/31/1950 | -40.14 | 1/31/1955 | 160.88 |
| 8/31/1956 | -29.72 | 5/31/1961 | 271.32 |
| 3/31/1967 | -26.72 | 7/31/1973 | 964.70 |
| 2/29/1984 | -73.37 | 9/30/1987 | 669.72 |
| 3/16/1989 | -33.36 | 7/5/1990 | 547.64 |
| 11/17/1992 | -66.82 | 1/18/1994 | 113.76 |
| 5/25/1994 | -32.47 | 7/21/1998 | 250.27 |
| 10/12/1998 | -38.43 | 9/17/1999 | 265.31 |
| 3/31/2003 | -76.91 | 10/31/2007 | 263.56 |
| 3/9/2009 | -72.45 | 10/14/2009 | 97.15 |
| 6/5/2012 | -83.56 | 3/19/2014 | 187.51 |
| 2/11/2016 | -67.81 | 2/1/2018 | 103.15 |
| 11/20/2018 | -33.82 | 1/24/2020 | 60.05 |
| 3/16/2020 | -48.94 |
The Volatile History of Greek Stocks and Bonds
Greek investors have had a volatile history. Greece defaulted on its debts soon after it issued its first bonds in 1824, and during the 1800s and 1900s, Greece was in default more often than not. Greece lied about its economy in order to join the Euro in 2001, and it defaulted on its debts between 2010 and 2015. Greek stocks and bonds have provided some of the worst returns of any country in the world during the past 50 years.
Greek investors made good returns between 1981 and 1999, providing stock investors with a 22% annual return and bond investors with a 9% annual return. However, returns during the twenty-first century have been miserable. After inflation, both Greece’s bond return index and its stock return index are lower in 2025 than they were in 1999. In fact, the inflation-adjusted Greek stock market index is below where it was at in 1961 and probably won’t return to the peak of 1973 for the rest of the decade.
This is not to say that there haven’t been any positive periods in Greece’s financial history. Greece provided good returns between 1920 and 1928, between 1945 and 1973, and between 1984 and 1999, but these strong returns were more than offset by the problems the country faced between 1973 and 1984 and between 1999 and 2020. Greece shows how political and economic instability negatively impacts returns to investors. The primary question is whether Greece can continue to recover during the next ten years. Greece has succeeded in stabilizing its economy, but the question is whether Greek politics will allow the country to continue its recovery.


