Dr. Bryan Taylor, Chief Economist, Finaeon
The First Opium War (1839-1842) ended with the 1842 Treaty of Nanking, which ceded Hong Kong to Britain, and opened five treaty ports, including Shanghai, to foreigners. The British began arriving in Shanghai in 1843, the Americans in 1844, and the French gained a Concession in 1848. In 1863, the American and British concessions were merged to form the Shanghai International Settlement. The development of Shanghai and Hong Kong began soon after when companies incorporated to develop industry. Banks, insurance, shipping, utilities and other important industries were founded in the 1860s and1870s to provide profitable investment opportunities in Shanghai and Hong Kong.
Unlike in Hong Kong, China retained sovereignty over the Shanghai International Settlement, but British industrialists were largely free to invest on their own. By 1918, merchants from 19 different countries were in Shanghai, and by 1925, the population of the International Settlement was over 1 million. The Japanese took over Shanghai, except for the International Settlement, in 1937 after Japan invaded China, and it seized the International Settlement in December 1941. The Japanese were defeated in August 1945, but by 1949, the Communists had defeated the Kuomintang, and the Shanghai Stock Exchange was closed for the next forty years.
The Shanghai Stock Exchange was closed in May 1949, and the Tianjin and Beijing Stock Exchanges were closed on July 21, 1952. No stock exchange existed in China between 1952 and November 26, 1990, when the Shanghai Stock Exchange (SSE) was established and opened for trading on December 19, 1990. When trading began, Chinese company shares were listed as either A-shares (listed in Shanghai or Shenzhen in Renminbi Yuan, representing over 99% of listed shares), B shares (listed in Shanghai or Shenzhen in USD or HKD), or H-shares (listed in Hong Kong in HKD). Because the Hong Kong Stock Exchange (HKSE) was easily accessible to the rest of the world, Chinese companies listed in Hong Kong to expand their access to capital. In July 2025, 1,438 Chinese companies were listed on the Hong Kong Stock Exchange out of a total of 2,337 companies. There were 377 “H” shares listed in Hong Kong which represented over 70 percent of the capitalization of companies listed on the Hong Kong Stock Exchange.
The perception of some analysts has been that when the Communists closed the Shanghai exchange in 1949, investors lost everything, just as Russian investors suffered losses when the St. Petersburg Stock Exchange was closed in 1917. It is probably more accurate to think of Shanghai and Hong Kong as regional exchanges within China, each serving their own investors. Just as the Austro-Hungarian Empire had exchanges in Vienna, Budapest, Prague and Trieste to serve local investors, and Germany had over 20 exchanges before World War I, China had exchanges in Shanghai, Hong Kong and Tientsin. When Austro-Hungary broke up into its constituent countries after World War I, the regional exchanges in Austro-Hungary became national exchanges in Austria, Czechoslovakia, and Hungary while Trieste became a regional exchange in Italy. Similarly, Berlin was the primary exchange in Germany before World War II, but Frankfurt succeeded Berlin after World War II. Because of the difficulties Shanghai suffered during the 1930s and 1940s under the Japanese, the Kuomintang and the Communists, Shanghai capitalists (both Chinese and British) moved their companies and their resources to Hong Kong. The capitalization of Chinese stocks fell from over $1 billion in 1925 to $50 million in 1949. Hong Kong became the primary stock exchange in China until the Shanghai and Shenzhen exchanges were opened in 1990.
Data Sources
The London and China Telegraph provided quotes of companies in Africa and Asia that listed on the London Stock Exchange between 1859 and 1869. In 1870, the periodical began publishing quotes from the HKSE and the SSE until the periodical’s demise in 1875. The North China Herald was a weekly newspaper from Shanghai published between August 3, 1850, and December 8, 1941. The publishers also produced The North China Daily News. These two newspapers provided share lists from the SSE between August 1870 and December 1941 and enable us to analyze 70 years of Chinese stocks in Shanghai.
The prices of Hong Kong shares were published between 1870 and 1961 in The China Mail, an English language newspaper that was published in Hong Kong between 1845 and 1974. The newspaper provided daily share lists from either local brokers or the Hong Kong Stock Exchange. This enabled us to collect share prices until 1962 when The Far Eastern Economic Review began publishing an index of Hong Kong stocks. In 1964, Q. W. Lee began calculating the Hang Seng Index which remains the benchmark for Hong Kong shares.
The North-China Herald also published the China Stock and Share Handbook between 1912 and the 1930s, listing all the companies in Shanghai, Hong Kong, and Tientsin as well as Japanese companies such as the South Manchurian Railway. Many companies cross-listed between Hong Kong and Shanghai. Chinese companies listed in Chinese Tael (Chinese Yuan after 1931), Hong Kong companies listed in Hong Kong Dollars, and British companies listed in British Pounds.
If you divide the Chinese companies listed on all three exchanges by currency, in 1929 the total listed in Chinese Tael was about $50 million, in British Pounds about $670 million (two-thirds of which was Shell Transport and Trading Co.), in Hong Kong Dollars about $175 million (of which $110 million was the Hong Kong and Shanghai Bank ) and $200 million in Japanese Yen, most of which was the South Manchurian Railway, though the Japanese companies only traded in Japan. The total listed in all currencies was about $1.1 billion, but the amounts for companies in Chinese Tael and Hong Kong Dollars were relatively small.
Companies Listed in Shanghai
Table 1 provides a sectoral analysis of the number of companies listed on the Shanghai Stock Exchange between 1866 and 1940. The decrease in the number of shares between 1866 and 1880 was primarily due to the decrease in the number of banks. Other sectors increased their representation. The number of stocks gradually increased between 1880 and 1910 and remained stable after that. Insurance, shipping, docks, wharves and godowns (warehouses) along with the broad category of “industrials” represented most of the shares on the SSE. In short, industries relating to exports were the driving force behind the Shanghai economy in the 1800s.
Table 1. Number of companies listed on the Shanghai Stock Exchange
| 1866 | 1880 | 1890 | 1900 | 1910 | 1920 | 1930 | 1940 | |
| Banks | 10 | 1 | 2 | 3 | 3 | 2 | 2 | 1 |
| Trusts | 1 | 1 | 5 | 8 | ||||
| Insurance | 2 | 7 | 11 | 8 | 6 | 8 | 9 | 3 |
| Shipping | 2 | 4 | 7 | 8 | 5 | 3 | 6 | 3 |
| Docks & Wharves | 3 | 3 | 6 | 7 | 5 | 5 | 5 | |
| Mining | 5 | 4 | 2 | 4 | 4 | 2 | ||
| Lands | 1 | 5 | 6 | 6 | 12 | 8 | ||
| Plantations | 3 | 5 | 47 | 42 | 41 | 35 | ||
| Cottons | 6 | 7 | 6 | 3 | 6 | |||
| Industrial | 3 | 3 | 8 | 12 | 17 | 8 | 14 | 17 |
| Stores | 2 | 5 | 8 | 6 | 5 | 1 | ||
| Miscellaneous | 2 | 2 | 5 | 6 | 7 | 7 | 5 | |
| Total | 22 | 18 | 48 | 68 | 113 | 97 | 113 | 91 |
Source: W. A. Thomas, Western Capitalism in China: A History of the Shanghai Stock Exchange, Aldershot, Burlington: Ashgate 2001, p. 36.
The largest increase in companies on the SSE occurred during the rubber boom of 1908-1910. Forty companies were added to the list, as Shanghai participated in the Malaysian rubber boom of 1908 to 1910. The rubber boom occurred because of the increased demand for rubber for tires for automobiles. The number of rubber shares increased dramatically in Singapore, London and Shanghai and money poured in from around the world.
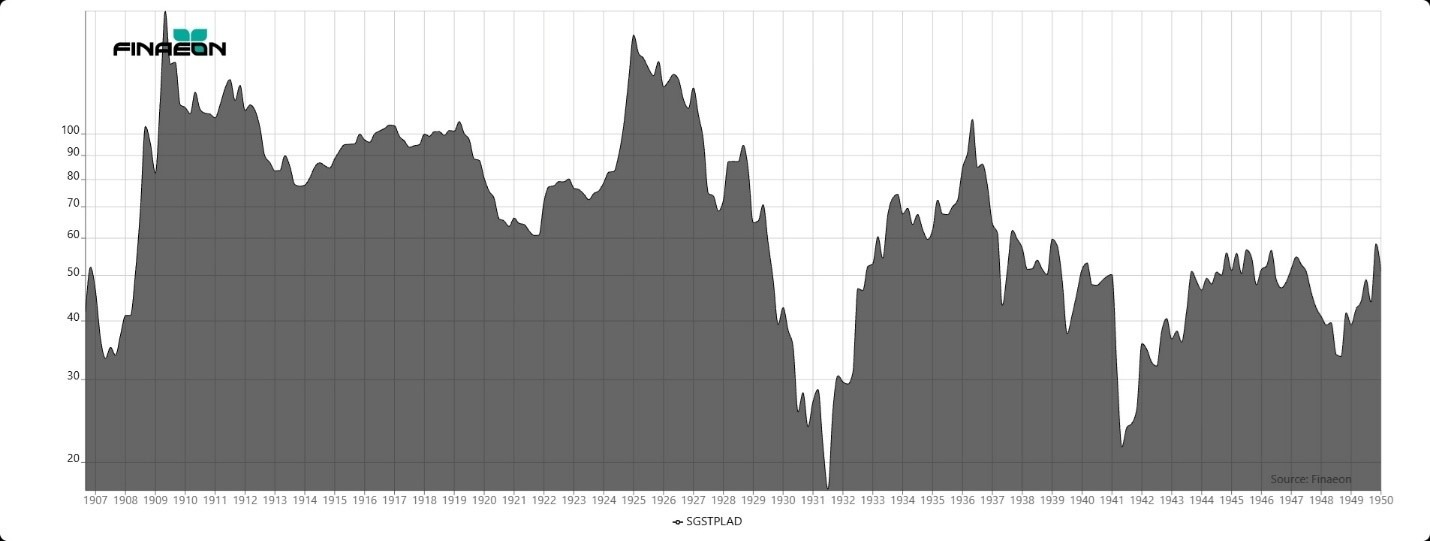
Figure 1 shows the performance of rubber shares in Singapore between 1906 and 1950. The dramatic increase in share prices between 1907 and 1909 stands out. Rubber shares never exceeded those highs during the next forty years. A second boom occurred in 1925, but rubber share prices collapsed during the Great Depression, losing over 90% of their value before bouncing back in the mid-1930s. Another collapse in rubber stocks occurred in 1941 when the Japanese occupied Malaysia. Although rubber shares represented the largest sector by number of companies, the capitalization of the companies was relatively small compared to other sectors.
Figure 1. Singapore Rubber Stocks Share Price Index, 1906 to 1950
Companies in insurance, shipping, and docks and wharves were on the Shanghai Stock Exchange throughout its existence because these three industries were essential for exporting goods from China to the rest of the world. Industrial companies increased their importance over time. The two largest industrial companies were the Shanghai Gas Co. and the Shanghai Waterworks Co. Cotton manufacturing companies and stores also increased their importance in Shanghai after 1900. Many cotton companies moved to Hong Kong after the Communists took over China in 1949.
If you break down the stocks by sector in 1929 according to the China Stock and Share Handbook, the largest sector by capitalization was the shipping sector, at $500 million primarily because of Shell Transport and Trading which represented 90 percent of the sector. The second largest were the 26 banking companies at $200 million, though seven-eighths of that were the Chartered Bank and Hong Kong and Shanghai Bank. Although railroads did not trade on Chinese exchanges, the South Manchurian Railway was capitalized at about $150 million. We estimate the amount of money invested into Chinese railways in 1925, primarily through bonds, to be about $400 million.
In China, railroads relied on debentures and government funding, not on equities, to fund their construction. The South Manchurian Railway issued $96 million in debentures which traded on the London Stock Exchange. The common shares only traded in Japan. The next largest sector were the rubber plantations, of which there were 41 listed in Shanghai with a market capitalization of $80 million. All of these plantations were listed in Shanghai, not in Hong Kong, and all were in Java and Malaysia, none were in China. The remaining 93 companies were allocated to 11 sectors with a total capitalization of $115 million.
Capitalization of different sectors between 1880 and 1940 is provided in Table 2. All values have been converted from Chinese Tael into US Dollars. Although there was a dramatic increase in the overall capitalization in Tael between 1920 and 1940 from 395 million Tael to 1,311 million Tael, the depreciation of the Tael meant that measured in US Dollars, capitalization fell by two-thirds. The capitalization of every sector except for Rubber Plantations declined dramatically in the 1930s as the Depression and Japan’s invasion of China impacted Chinese industry and the stock market. In the 1930s, rubber stocks became the primary source for speculation in Shanghai. After World War II, the capitalization of the SSE fell to $50 million.
Table 2. Capitalization of the Shanghai Stock Exchange in US Dollars
| 1880 | 1900 | 1920 | 1940 | |
| Banks & Finance | 8,465,413 | 22,673,635 | 77,805,329 | 18,475,772 |
| Insurance | 6,892,382 | 5,291,039 | 30,398,514 | 5,636,986 |
| Shipping | 1,257,986 | 6,608,237 | 26,244,115 | 55,249 |
| Plantations | 3,890,016 | 17,641,932 | 19,428,189 | |
| Mining | 4,666,578 | 20,441,155 | 6,460,422 | |
| Docks, wharves & godowns | 662,520 | 11,697,395 | 19,955,144 | 7,976,315 |
| Land | 6,940,307 | 9,874,167 | 3,938,995 | |
| Industrial | 834,255 | 2,840,056 | 28,957,128 | 1,247,314 |
| Spinning | 1,442,051 | 21,188,009 | 10,982,420 | |
| Stores | 748,055 | 1,158,238 | 67,784 | |
| Miscellaneous | 1,011,431 | 18,780,521 | 989,127 | |
| Company securities | 18,112,557 | 67,804,177 | 272,446,475 | 86,436,958 |
| Shanghai Municipal Council | 107,876 | 651,810 | 13,836,603 | 2,964,889 |
| Company debentures | 20,224 | 1,805,473 | 6,575,082 | 9,892,871 |
| Government Loans | 13,917,675 | 1,004,781 | ||
| Total | 32,158,331 | 71,266,241 | 292,858,160 | 99,294,718 |
Source: W. A. Thomas, Western Capitalism in China: A History of the Shanghai Stock Exchange, Aldershot, Burlington: Ashgate 2001, pp. 72-73. Converted from Tael into US Dollars.
In Shanghai, most companies were listed in Chinese Tael, and after 1931 in Chinese Yuan. The Chinese Tael was the primary unit of exchange in China before World War I. It was equivalent to about 1.3 ounces of silver. The Chinese Yuan was introduced on May 25, 1910, with 1 Chinese Tael equal to 0.72 Chinese Yuan.
Over 300 companies were listed in Shanghai in Chinese currency between 1870 and 1941 providing every type of service imaginable in the International Settlement. Shanghai companies represented over 80% of the companies listed on the SSE. This included 60 companies that were located in Malaysia providing funding for rubber plantations, tobacco plantations or mining tin. There were also 40 transport companies, which mainly included either shipping companies, docks, wharves and godowns to ship goods out of Shanghai to the rest of the world. Shanghai Waterworks was one of the few purely Chinese companies that listed in London. There were several cotton spinning plants that listed in Shanghai, and several of them moved to Hong Kong after the Communists took over.
The largest “Chinese” company of all, the South Manchurian Railway, never listed in Shanghai or Hong Kong, it only listed in Japan. Technically, it was not in China since it was in Japanese-occupied Manchuria and was built by the Japanese to promote Manchuria’s economic development. There were no railroad shares listed in either Shanghai or Hong Kong. China was slow to build railroads to help modernize the economy. A few small railroads were built in China in the 1880s, but it took China’s defeat in the First Sino-Japanese War in 1895 to force the Chinese government to recognize the benefits of modernizing and to encourage foreign countries to build railways in their Chinese spheres of influence to aid commerce and connect China’s major cities. Most of the larger railroads were joint projects with foreign governments who loaned money to the companies that built the railroads. Provincial governments issued shares in railroads, but when the railroads fell into bankruptcy in 1911, foreign powers took them over.
Although there were about 20 companies whose shares traded in GBP in Shanghai, none of those companies depended upon capital from Shanghai, but raised funds in London. Their shares traded first in London, second in Hong Kong, and lastly in Shanghai, Singapore or other exchanges. The Hong Kong and Shanghai Bank, Shell Transport and Indo-China Steam Navigation traded in Shanghai, more out of convenience to local investors than out of necessity. Finally, there were about three dozen companies from Hong Kong whose shares cross-listed in Shanghai. These were the larger, more liquid companies from Hong Kong which appealed to Shanghai investors, such as banks, insurance companies, shipping companies and utilities. A list of shares that cross-listed between Shanghai and Hong Kong is provided in Appendix Table 1.
Bull and Bear Markets in China
Share trading began in Shanghai in the 1860s, leading to a speculative bubble that collapsed in 1873, producing the most severe bear market in Chinese history until the Bear Market of 1992 occurred. Information on Bull and Bear markets in Shanghai between 1870 and 1941 is provided in Table 3. Further speculation in the early 1880s led to another bubble which burst in 1883 during which native banks were forced to close and share prices collapsed. A bank crisis began in Hong Kong in 1890 when the shares of the Hong Kong & Shanghai Bank collapsed due to financial embarrassment and led to a market top in 1891. Shares in both Hong Kong and Shanghai declined in 1891 during the panic that followed. After China was defeated in the First Sino-Japanese War of 1894-1895, the 1895 Treaty of Shimonoseki provided concessions to Japan and led to new inflows of capital into China as Japanese and Europeans both took advantage of the concessions.
Table 3. Bull and Bear Markets in Shanghai for Shares in CNT and HKG, 1869 to 1941
| Bottom | Bear Decline | Top | Bull Rise |
| 12/31/1869 | 1/31/1873 | 53.51 | |
| 07/31/1875 | -58.29 | 08/31/1878 | 157.43 |
| 3/31/1879 | -31.19 | 02/28/1883 | 130.82 |
| 10/31/1884 | -29.18 | 02/28/1891 | 47.09 |
| 08/31/1892 | -41.09 | 7/31/1909 | 492.93 |
| 3/31/1920 | -42.74 | 2/28/1931 | 188.11 |
| 10/31/1935 | -53.84 | 6/30/1937 | 98.06 |
| 7/31/1940 | -48.10 | 11/30/1941 | 138.37 |
The greatest increase in share prices in Shanghai occurred between the signing of the Treaty of Shimonoseki and the rubber boom of 1908-1910 when demand for rubber for automobile tires led to a world-wide speculative bubble for rubber shares not only in Singapore and London, but in Shanghai as well. Prices were pushed up in the Spring of 1909 in a speculative fever, but when traders were forced to settle in June 1909 after the bubble had peaked, the decline in prices forced many traders to default pushing prices further down and ending the bubble.
Investors in Shanghai participated in the rubber boom and over 50 shares were eventually traded in Shanghai for rubber plantations in Malaysia and the Netherlands Indies. Curiously, rubber shares were not traded in Hong Kong, and the attempt to transfer the listing of shares from Shanghai to Hong Kong after World War II largely failed. The fall of the Qing Dynasty in 1911 perpetuated the bear market that had begun with the collapse in the rubber share market. The SSE closed between July 30 and November 26 in 1914 because of World War I, and during the war, share prices continued their downward drift. There was a brief bubble in cotton shares in 1919 caused by the post-war increase in the demand for cotton goods, but this quickly subsided. The performance of shares in Shanghai between 1869 and 1941 is provided in Figure 2.
Figure 2. Chinese Index for CNT and HKD Stocks in Shanghai, 1869 to 1941
Stocks ended their decade-long decline in 1920. Stocks enjoyed a solid rally during the 1920s. There was a second rubber bubble in 1925 when the price of rubber, and thus rubber stocks, rose dramatically, but prices fell back in 1926. The Shanghai Stock market peaked in September 1931, sometime after the peak in the rest of the world. Shanghai accounted for about half of China’s trade, so the Great Depression had a large impact on the stock market in Shanghai. There was sufficient interest in shares in the 1930s that Swan, Culbertson and Fritz calculated three weekly Shanghai indices for 23 Rubber Shares, 16 General Shares and Internal Bonds. Most of the activity on the SSE in the 1930s occurred in rubber shares which local investors speculated in.
Share prices collapsed in 1935, then recovered between 1935 and 1937, but the incident at the Marco Polo bridge near Peking in July 1937 launched the second Sino-Japanese War. The Battle of Shanghai was fought between August and November of 1937 when the Japanese took control of all of Shanghai except for the International Settlement in November 1937. The Shanghai stock exchange continued to operate after 1937 even though the rest of Shanghai was occupied by the Japanese. Shares surged between September 1939 and May 1940, but the stock exchange collapsed in June 1940 with the fall of France. The Shanghai Stock Exchange closed on December 7, 1941, when the Japanese took control of the International Settlement. Shanghai remained under Japanese occupation for the next four years.
Returns to stocks and bonds over different periods of time to combined CNT and HKD stocks as measured in real USD is provided in Table 4. Unfortunately, data for returns to cash are not available. As measured in nominal CNT/CNY between 1869 and 1939, stocks returned 4.93% per annum, but after converting into real USD, the return was only 0.39% per annum. The highest returns were provided during the decade of the 1900s when Shanghai benefitted from the bubble in rubber stocks, but returns were negative between 1910 and 1940, primarily because of the political and economic chaos that China endured during those three decades. The fall of the Qing Dynasty, World War I, the civil war with the Communists, the invasion of China by Japan, inflation, warlords, political corruption, all took their toll on the Chinese economy and stock market. When the SSE reopened after World War II, hyperinflation drove nominal prices dramatically upward, but real prices declined.
Table 4. Returns to Stocks and Bonds in Shanghai in Real USD, 1869 to 1939
| Stock Price | Stock Return | Bond Return | |
| By Decade | |||
| 1869-1879 | 4.54 | 9.14 | |
| 1879-1889 | 4.12 | 5.4 | 4.71 |
| 1889-1899 | -5.31 | -2.87 | 1.31 |
| 1899-1909 | 10.38 | 11.52 | 4.23 |
| 1909-1919 | -2.96 | -1.38 | 4.07 |
| 1919-1929 | -4.62 | -2.82 | -3.65 |
| 1929-1939 | -14.29 | -13.96 | -11.36 |
| By Period | |||
| 1873-1896 | -0.4 | 0.74 | |
| 1896-1914 | 1.99 | 2.99 | -0.24 |
| 1914-1929 | 1.17 | 3.24 | 3.7 |
| 1869-1939 | -1.2 | 0.39 | |
| 1899-1939 | -2.83 | -2.07 | -1.89 |
Comparing Stock Performance for Chinese and Hong Kong Stocks in Shanghai
Which shares should be included in the Shanghai Stock Exchange Index? Should the stock index include both Shanghai and Hong Kong shares? Should it include shares listed in Hong Kong Dollars, Chinese Tael or British Pounds? Although Shell Transport and Trading was a British company located in Java, its shares traded in London, Shanghai, Hong Kong and Singapore, and it had the largest capitalization of any listed company in Shanghai, representing about half of the capitalization of Chinese-listed shares in 1925. Shell Transport was four times the size of the Hong Kong and Shanghai Bank. However, if you include those two companies in a capitalization-weighted index, the index won’t reflect the performance of Shanghai companies but will primarily reflect the performance of British companies that listed in Shanghai.
Wenzhong Fan constructed indices for the Shanghai Stock Exchange between 1870 and 1940 using data from the North-China Herald.[1] However, Wenzhong Fan did not analyze the complexity of shares listed on the Shanghai Stock Exchange. First, Fan’s analysis only looked at end-of-the-year pricing of shares in Shanghai. There were often significant changes in prices within a year and so it is important to calculate indices on at least a monthly basis. Second, Fan converted the prices of all the stocks into US Dollars to avoid the impact of the inflation that occurred in Shanghai between 1937 and 1941.
All of our indices are monthly rather than annual. We have calculated separate indices for stocks in both Hong Kong and Shanghai based upon the currency the stocks were listed in (CNT, HKD and GBP). We also calculated indices for all stocks regardless of the currency they were listed in. The combined indices are calculated in HKD so the performance of shares in Shanghai and Hong Kong can be compared. Calculating in HKD avoids the inflation of Chinese shares during the 1940s.
The China Stock & Share Handbook kept track of shares on three exchanges in Shanghai, Hong Kong and Tientsin. The Tientsin stock exchange was small and only included a few local stocks that didn’t list in either Shanghai or Hong Kong. Both the Shanghai and Hong Kong stock exchanges were located in the International Settlements that western powers had obtained from China. While Shanghai was occupied in the 1940s, the Chinese Merchants’ Exchange in Shanghai listed and traded shares that were owned by Chinese nationals, not foreigners. These companies were not listed on the SSE, and behaved differently from the British shares, but unfortunately, very little data for the stocks traded on the Chinese Merchants’ Exchange are unavailable.
The North-China Herald was both a daily and a weekly publication that reprinted the Shanghai Stock Exchange Weekly Share Report through November 14, 1941, courtesy of J. P. Bisset & Co. The North-China Herald also published The China Stock & Share Handbook between 1912 and the 1930s which provided information on shares traded in Shanghai, Hong Kong and Tientsin. The newspaper printed cash prices for Buyers, Sellers and Last Sales as well as information on the amount of Authorized Capital, Issued Capital, Paid Up Value, Dividends, Shares Traded and Sales Reported. The last issue was published on November 19, 1941, which contains quotations for November 14, 1941. Prices for the Shanghai Stock Exchange were also printed in Le Journal de Shanghai, issues of which are available from Gallica. December 5 was the last day of trading in Shanghai because the Japanese closed the Shanghai Stock Exchange after the Japanese took over the International Settlement. William Thomas published Western Capitalism in China, primarily relying upon the North-China Herald as the primary source for his analysis of stocks and bonds that were traded in Shanghai.
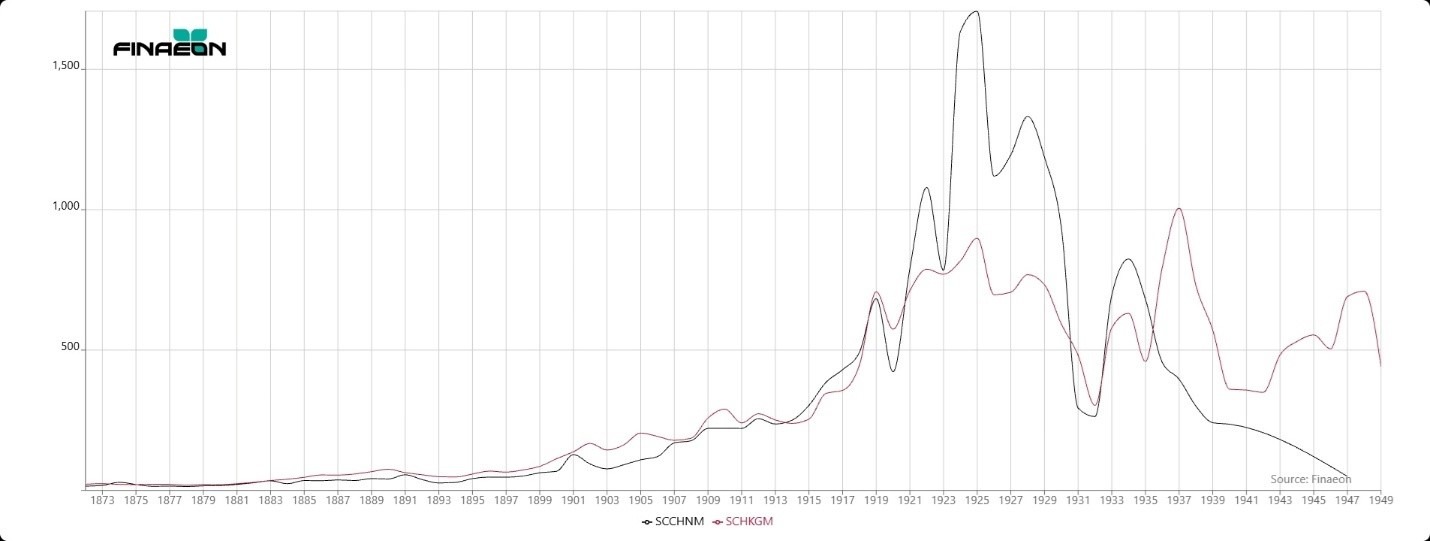
Most shares that were traded on the SSE were denominated in Chinese Tael, Chinese Yuan, Hong Kong Dollars, or British Pounds. Most shares were listed in Chinese Tael originally and in Chinese Yuan after 1931. Some Hong Kong companies that cross-listed on the Shanghai stock exchange were traded in Hong Kong Dollars, and British companies that listed on the London SE traded in British Pounds Sterling.
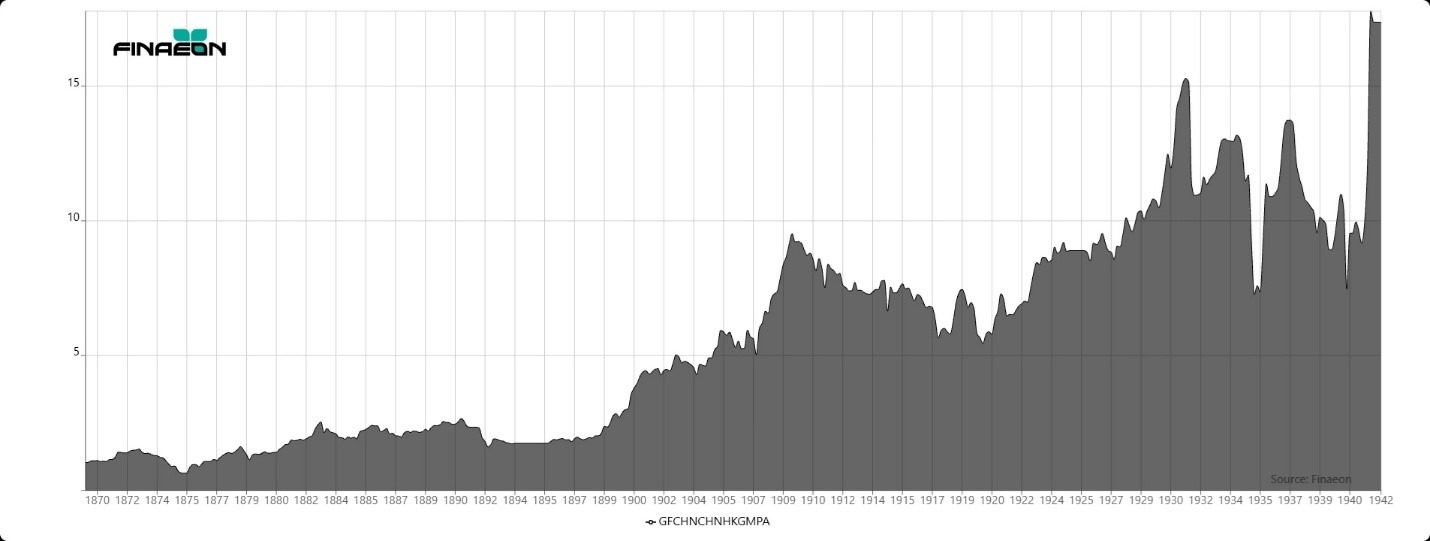
We have calculated indices for both the shares listed in Chinese Tael/Yuan (black) and the shares listed in Hong Kong Dollars (red). The results are provided in Figure 3. One of the primary differences between the two indices is the inclusion of Malayan rubber stocks in Shanghai, but not in Hong Kong. In addition to that, the Hong Kong & Shanghai Bank is included in the Hong Kong index, and was the largest company in the index, but it was not included in Shanghai. Shares listed in Chinese Tael clearly underperformed Hong Kong shares in the 1920s and 1930s. In fact, the Tael/Yuan index was below its level in 1902 when the Japanese took over the International Settlement in 1941. A comparison between Figure 3 and Figure 2 will show that the CNT/HKD index reflects the performance of HKD stocks more than CNT stocks because the HKD stocks had a greater capitalization than the CNT stocks. Measured in Chinese Yuan, Yuan listed shares showed a dramatic increase between 1935 and 1941, increasing sevenfold. However, this was mainly driven by inflation. As measured in HKD, Shanghai stocks’ performance was mediocre at best.
[1] See Wenzhong Fan, “Construction Methods for the Shanghai Stock Exchange Indexes, 1870-1940.” manuscript
Figure 3. Chinese and Hong Kong Stocks in Shanghai in HKD, 1877 to 1941
The Performance of Chinese Bonds
Chinese government bonds were traded in Shanghai by investors who used them for income until the exchange closed in 1949. China issued its first bond in 1874 in London, the Foochow Loan for £627,675 at 8% and was repayable within 10 years. The yield was similar to Japan’s first bonds issued in1870. Between 1874 and 1886, nine Chinese loans were issued totaling £4,900,000. The China Steam Navigation Company issued the first Chinese corporate loan for £300,000 in 1885 at 7%.
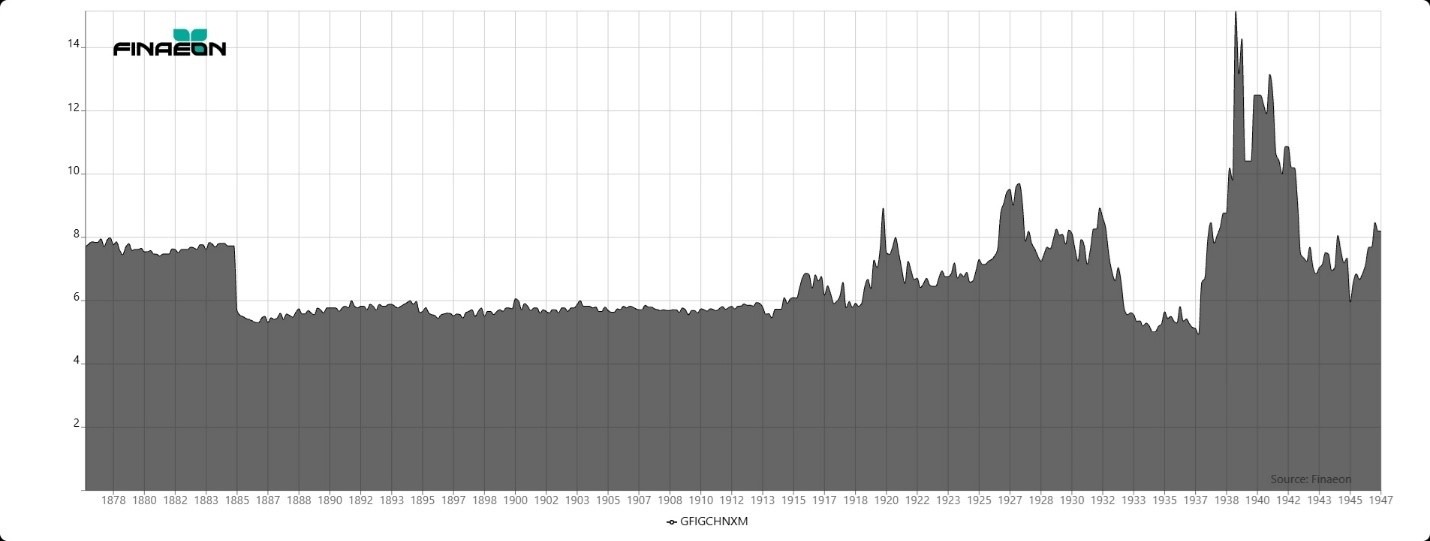
A new bond was issued for China at 6% in 1885. Most bonds were issued to fund railroads in China at a coupon of 5%. Yields stayed below 6% until the beginning of World War I. After World War I ended, the risk of default and inflation increased so the yield on Chinese bonds rose. The price of Chinese bonds fluctuated up and down as perceptions of the stability or more often the instability of the Chinese government changed. After the Japanese invasion of China in 1937, China defaulted on its bonds in 1938 and the price of Chinese bonds plummeted, with implied yields rising as high as 15%. During World War II, investors assumed the Allies would help China pay off its bonds once the war was over, so yields remained below 8%, but once the Communists began to defeat the Kuomintang in 1947, the price of Chinese government bonds collapsed. Chinese companies also issued bonds and by the 1930s, 21 companies issued bonds that traded on the Shanghai Stock Exchange.
Figure 4. Yield on Chinese Government Bonds in London, 1874 to 1947
What happened to the SSE when the Communists took over China?
After the Japanese were defeated in China in August 1945, the civil war between the Communists and the Kuomintang resumed. Initially, the Kuomintang had more territory, a larger army, the backing of Western governments, and more weapons than the Communists, but the demoralized and undisciplined National Revolutionary Army of the Kuomintang proved to be no match for the People’s Liberation Army. The Chinese people were tired of the corruption and economic and political chaos of the Kuomintang and supported the Communists. By 1947, a string of Communist military victories made it apparent that the Communists would defeat Chiang-Kai Chek and the Kuomintang, and it wasn’t a matter of if, but of when the Communists would be victorious. Beijing fell to the Communists in January 1949, Shanghai and Nanking in April 1949, and Canton (Guangdong) in October 1949. On October 1, 1949, Mao Zedong declared the creation of the People’s Republic of China in Peking.
But what happened to the Shanghai Stock Exchange when the Communists took over the country? The conclusion by some is that investors lost everything, but did they? In fact, many of the Shanghai capitalists, both British and Chinese, moved their capital and their businesses to Hong Kong before and after the Communist victory and continued to operate in the British colony.
Before the Pacific War
The Japanese attacked Shanghai on August 13, 1937, and defeated the Chinese on November 26, 1937. The Japanese seized all of Shanghai except for the Shanghai International Settlement and the Shanghai French Concession. The Shanghai Stock Exchange, which was in the Shanghai International Settlement continued to operate, but closed on December 5, 1941, when the Japanese took control of the International Settlement. The Japanese also took control of Hong Kong on December 7, closing the stock exchange in Hong Kong until 1946.
The Shanghai Stock Exchange reopened in September 1944 and remained open until August 1945, when the Kuomintang closed the exchange. The SSE reopened in September 1946 with just 20 stocks listed. The stock exchanges in Tientsin and Shanghai were closed once again in August 1948 so the Nationalist government could reform its monetary system. The Shanghai Stock Exchange resumed operation in March 1949, but was closed by the Communists in May 1949, not to reopen for forty years. The PRC reestablished the Tianjin Stock Exchange in 1949 and the Beijing Stock Exchange in 1950 with ten and six stocks listed respectively, but both stock exchanges were shut down in 1952 because the stock exchanges were too speculative for the Communists, and they contradicted Marxist economic principles.[1]
There are several sources which can be used to find out what happened after the Pacific War ended and China was no longer ruled by the Japanese. The Shanghai Evening Post and Mercury, issues of which are available from the Internet Archive, was published in New York and it provided prices for both the Shanghai Stock Exchange and the Manila Stock Exchange. The newspaper was published in New York using radio reports from China. This is why one of the prices for the Shanghai Stock Exchange was listed as “garbled.” The China Mail was published in Hong Kong and enables us to keep track of the Hong Kong Stock Exchange on a daily basis after trading resumed in 1946, but another good source for information about the Shanghai Stock Exchange after 1945 is the Far Eastern Economic Review, which provided reports on the fall of Shanghai and the fears that many people in Hong Kong had that the Communists might seize Hong Kong, which did not happen at the time.
An index of Chinese shares showed a rise from 167 in January 1943 to 1357.7 by December 1943, reflecting the ongoing inflation. The Chinese Merchants Securities Exchange opened in November 1943 with 200 brokers and 108 shares listed. As inflation increased during the war, share prices increased, with some shares increasing in price by a factor of 4,000. The Shanghai Securities Exchange was allowed to reopen in September 1946 with 210 members, 32 stock listed and a market value of around £170,000 ($700,000). High interest rates drove prices down in 1947 with many shares losing over half of their value.[2]
There were two exchanges trading shares in Shanghai, the Shanghai Merchants’ Stock Exchange which was owned and operated by Chinese, and the Shanghai Stock Exchange which was organized by foreign businessmen. This is where the designation of “Chinese” and “British” shares came from. Both were closed after the Japanese took control of Shanghai in 1941, but a black market sprung up to trade shares. The Shanghai Chinese Securities Exchange was allowed to open in September 1944, and the Shanghai Securities Exchange was organized in May 1946. Share trading began on September 16, 1946.
The Far Eastern Economic Review provided price quotes from the Shanghai Stock Exchange for ten “Chinese” shares from the Chinese Merchants Securities Exchange and eight “British” shares from the Shanghai Securities Exchange through May 1947, but no Shanghai quotations were provided after that. Some of the “British” shares were also quoted in Hong Kong while the “Chinese” shares were exclusive to Shanghai. Quotes on six shares were provided by the Shanghai Evening Post and Mercury in 1946. Because China suffered from hyperinflation between 1946 and 1949, prices of shares in Shanghai skyrocketed while prices in Hong Kong remained relatively stable. Shanghai Dockyards shares were quoted at CN$172,000 in May 1947 in Shanghai, but HK$12 in Hong Kong. Arbitrageurs kept track of the exchange rate and differences in prices to profit from differences between Shanghai and Hong Kong. Since Shanghai allowed a seven-day deferral, this enabled arbitrageurs to balance prices between Shanghai and Hong Kong. A British trade mission in China in 1947 reported that “there is hardly a British firm in Shanghai which has not since the war transferred its principal office in China from Shanghai to Hong Kong.”[3] This was aided by the merger of the Hong Kong Stock Exchange and the Hong Kong Shareholders’ Association in 1947. Hong Kong replaced Shanghai as the primary stock exchange in China.[4]
There were two articles in the Far Eastern Economic Review report on events in the Shanghai Stock Exchange in 1948 and 1949. In “Shanghai Shares in Hongkong,” the article said that substantial business was done in Hong Kong in three Chinese shares, Ewo Cotton Mills, Shanghai Lands and Shanghai Dockyards. Traders in Hong Kong arbitraged shares between Hong Kong and Shanghai. The interest in Shanghai shares led to trading in non-quoted stocks in Hong Kong, which included not only the rubber shares of Indonesia and Malaysia, but Shanghai Loan, Shanghai Exploration, Shanghai Gas, Anglo-French Lands and Hongkew Wharves as well as Wheelocks, Yangtze Finance and Asia Navigation. Eventually, these securities listed in Hong Kong and their prices were quoted in the China Mail. Despite the attempts to dispose of these securities in Hong Kong, there needed to be an interest in them for the market to thrive.
When the “Economic Reform” measures of the Kuomintang were announced on August 19, 1948, share trading was declared illegal and trading on the share market in Shanghai was shut down. This forced trading underground into black markets. The main trading on the black market was in British companies, especially ones listed in Hong Kong. Until the end of 1947, 245 brokers were authorized by the Ministries of Finance and Economic Affairs to trade shares, but only 32 stocks were admitted for transaction. Trading on the Shanghai exchange included 29,533 million shares. The capitalization of the Shanghai Exchange was CN$7.078 billion at the end of 1947, which at an exchange rate of CN$140,000 to the U.S. Dollar made the capitalization of the Shanghai Stock Exchange about US$50 million.[5]
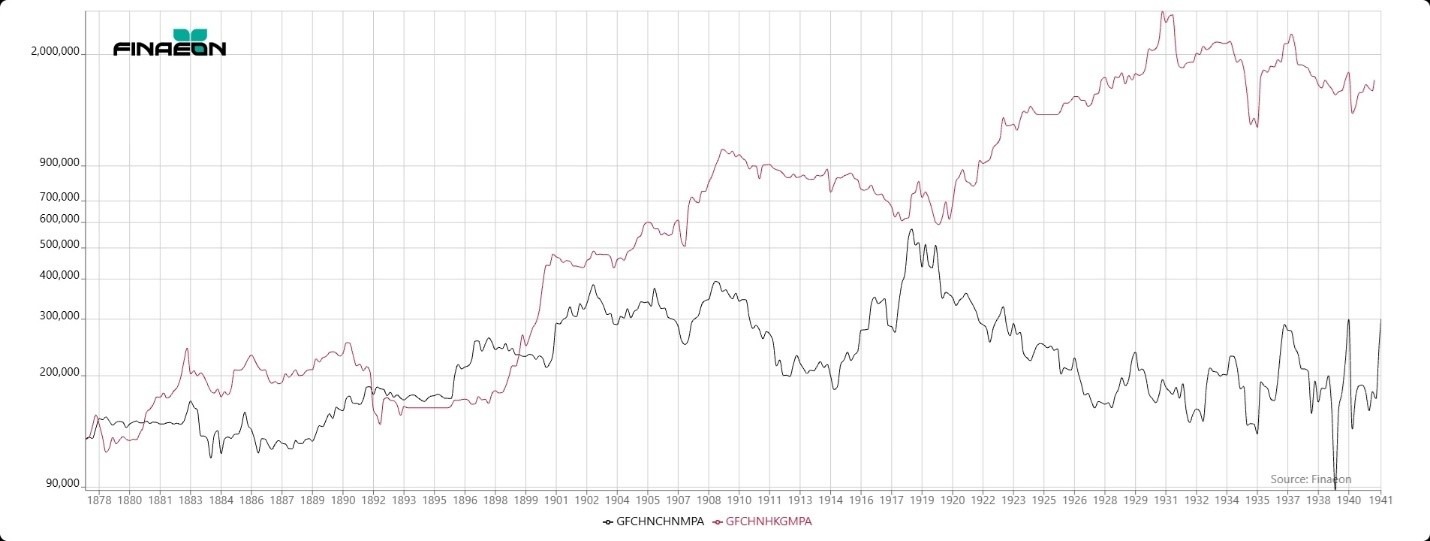
This meant that the capitalization of Shanghai had declined dramatically from before the Pacific War. The capitalization of the Shanghai exchange between 1870 and 1947 is illustrated in Figure 5. By contrast to the $50 million capitalization of Shanghai in 1947, the market capitalization of the Tokyo Exchange in 1947 was around US$425 million. This is a substantial decline from 1925 when the capitalization of Chinese stocks was over US$1 billion during the rubber rally. Initially, all deals on the Shanghai exchanges were cash only, but in November 1946, deferred dealing was introduced.
[1] Chen Ji and Steve Johnson, “Emerging Stock Markets in the People’s Republic of China,” Financial History, Spring 2003, Pp. 28-31.
[2] “Stock & Share Business in Shanghai,” Far Eastern Economic Review, February 23, 1949, pp. 231-232
[3] William Arthur Thomas, Western Capitalism in China: A History of the Shanghai Stock Exchange, Aldershot, Burlington: Ashgate 2001, p. 234
[4] “Shanghai Shares in Hongkong,” Far Eastern Economic Review, December 22, 1948, p. 658.
[5] “Stock & Share Business in Shanghai,” Far Eastern Economic Review, February 23, 1949, pp. 231-232
Figure 5. Capitalization of Hong Kong and Shanghai Exchanges in USD, 1870-1947
There was trading in about 30 Chinese stocks in Hong Kong in 1947 which were not listed on the Exchange. Considerable business was done in “foreign” (i.e. Chinese) stocks such as Ewo Cotton, Shanghai Dockyards, China Fibre, Shanghai Realty, Asia Navigation, Ewo Brewery, Chinese Metals and Wheelocks. The capital of these stocks in Shanghai was converted into Hong Kong Dollars so their quotations could be coordinated with quotations on the Hong Kong Exchange. This also eliminated the impact of the hyperinflation that China was suffering. Although Shanghai had the only official exchange in China, trading also occurred in Tientsin, Hankow and Canton. The Tientsin Stock Exchange was established in February 1947 where 13 stocks were listed including Chi Hsin Cement, East Asia Development, and Tsi An Water Works.
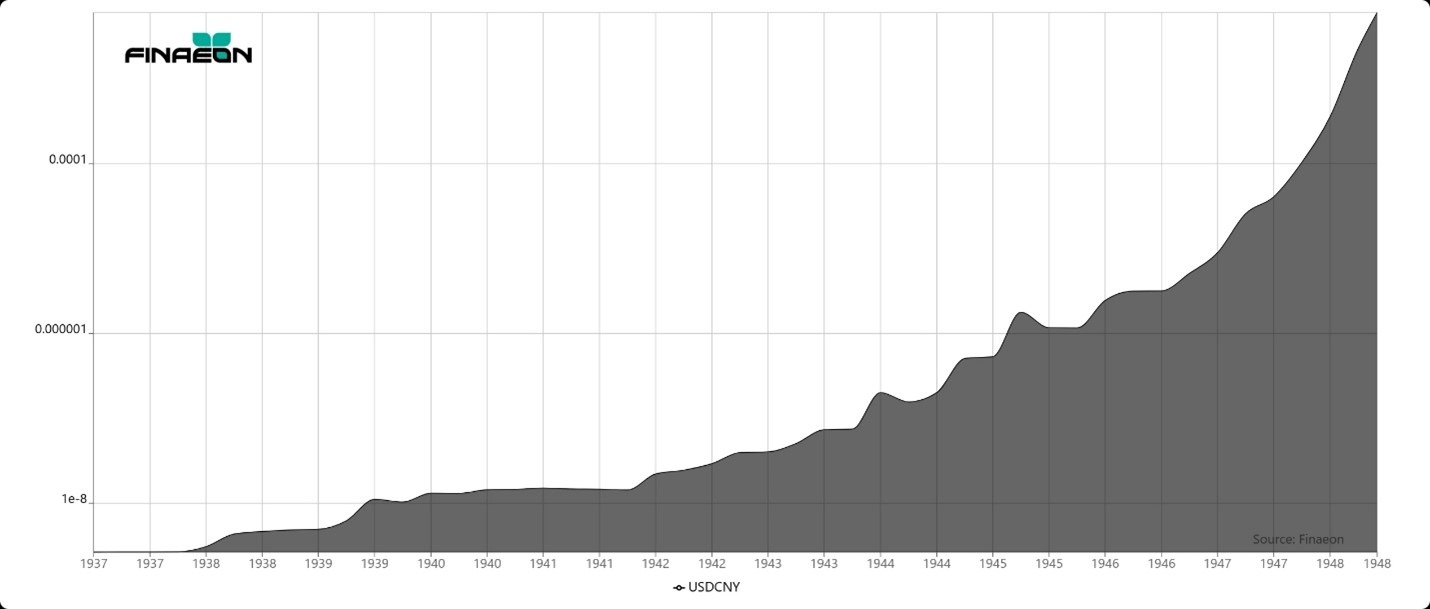
The collapse of the Chinese Yuan drove prices more than fundamentals. Figure 6 illustrates the exchange rate between the Chinese Yuan and the US Dollar showing its continual decline between 1937 when the Pacific War began and August 19, 1948, when the Gold Yuan was introduced at a rate of 3 million Chinese Yuan equal to 1 Gold Yuan. The US Dollar was equal to 4.05 Gold Yuan in August 1948, but the Gold Yuan quickly collapsed in value and fell to 425 million Gold Yuan to the U.S. Dollar by September 1949 when the Communists took over China.
Figure 6. Chinese Yuan per U.S. Dollar, 1937 to 1948
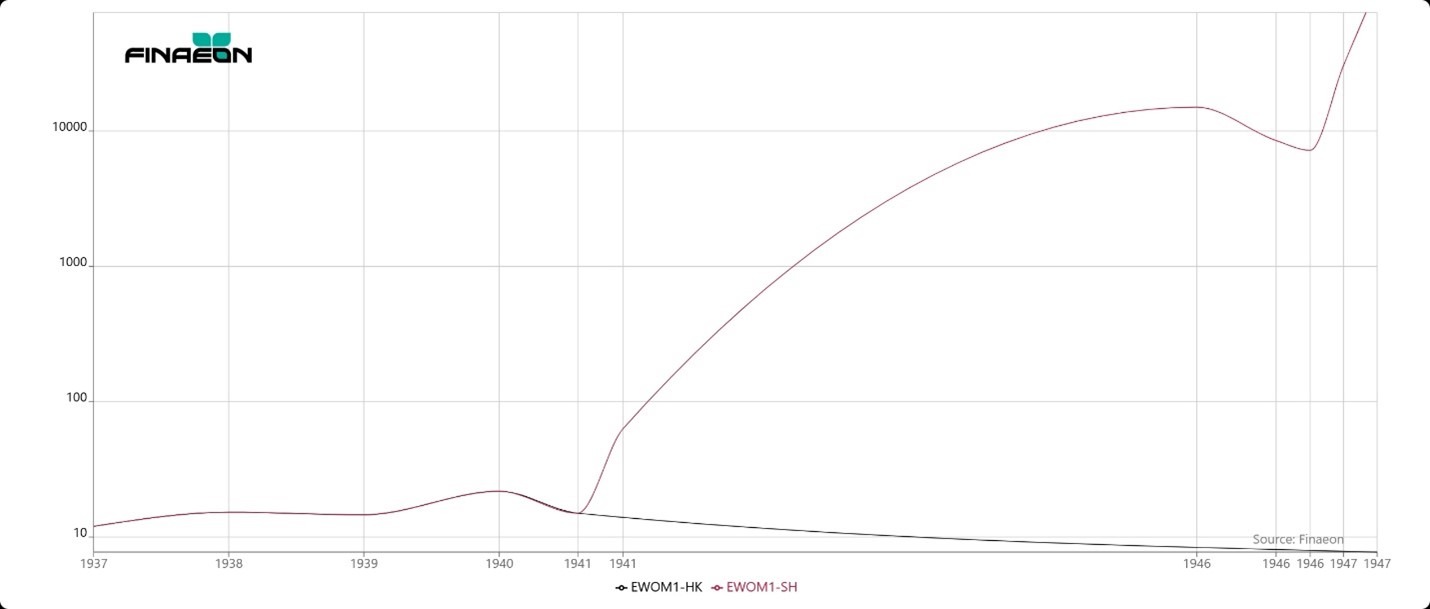
The impact of the inflation in Shanghai can be seen in a comparison of the performance of Ewo Cotton Mills on the Hong Kong and Shanghai stock exchanges. The two stocks are illustrated in Figure 7. The red line shows the path of Ewo Cotton Mills in Shanghai and the black line shows the path of Ewo Cotton Mills in Hong Kong. While the price of the stock in Hong Kong declined after 1940, the price of the stock in Shanghai increased dramatically as inflation drove the price upward. By May 1947, the price of Ewo Cotton Mills in Shanghai was CN$75,000 while the price in Hong Kong was HK$10. Before the Pacific War, their prices had been the same in Shanghai and in Hong Kong.
Figure 7. Ewo Cotton Mills in Shanghai (red) and Hong Kong (black), 1937-1947
As the Communists approached Shanghai, investors knew that it was only a matter of time before the Communists took over the city. Shanghai investors moved their holdings out of Shanghai and into either foreign shares listed in London, New York, Tokyo, or into Hong Kong. There was initially a “wait and see” attitude among investors who hoped they could work with the Communists once they took over Shanghai and the rest of the country.
The Communists quickly defeated the Kuomintang in Shanghai in April of 1949 and factories, especially linen factories, began operating once again. At first, Shanghai industrialists were relieved that the Communist takeover of Shanghai had been quick and peaceful with a minimum of destruction; however, because the Communist philosophy was antithetical to stock market capitalism, Shanghai industrialists began moving their operations to Hong Kong. Chinese shares were listed in Hong Kong in 1948 and quoted in Hong Kong through November of 1950 as Hong Kong became a substitute for the Shanghai Stock Exchange which was closed in April 1949. The China Mail continued to quote around 80 stocks until October 1950 when the number of quoted stocks fell into the thirties. Chinese shares quickly lost their value.
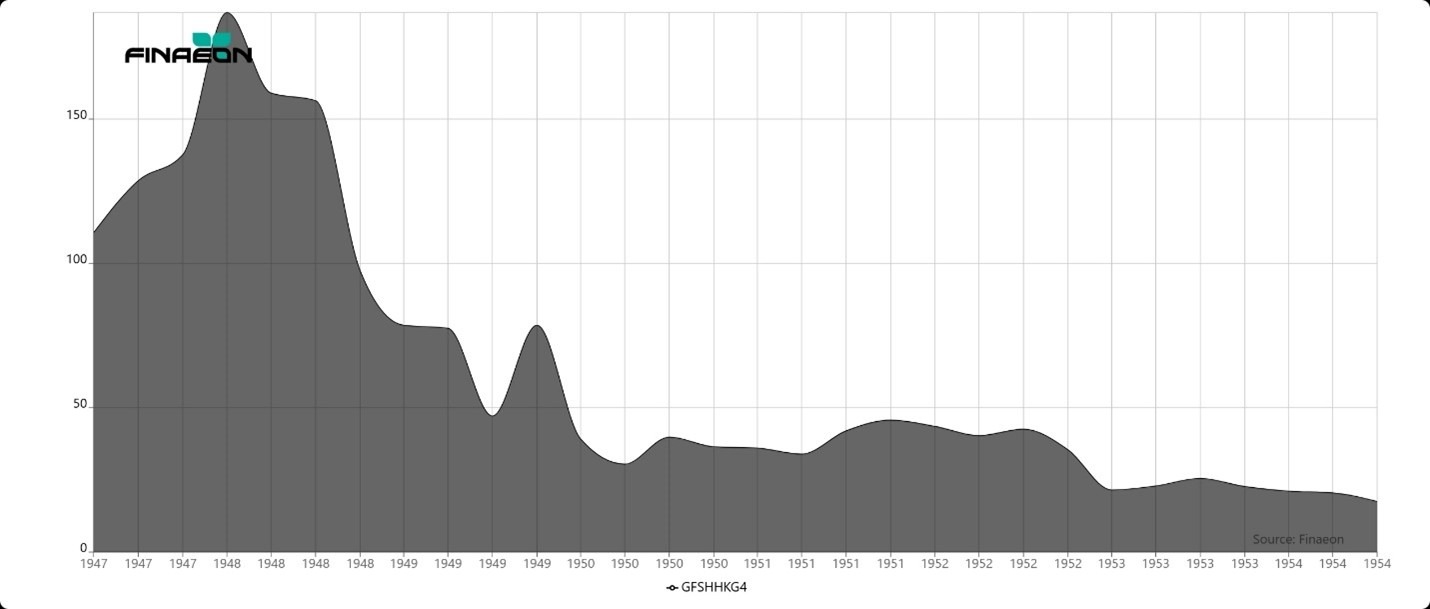
How would investors in Shanghai have done while the Communists were taking control of China? To answer this question, we took four stocks that traded in both Shanghai and Hong Kong and created an index of their performance in Hong Kong. The index was equally weighted and included three stocks beginning in April 1947, Ewo Cotton Mills, Shanghai Dockyards and Shanghai Land Investment Co. and we added Wheelock Co. in December 1948. The index of these four stocks is provided in Figure 4. At first, the index doubled in value, rising from 94.3 in July 1947 to 193.4 in May 1948. By the time the Communists had taken over Shanghai in April 1949, the index had lost two-thirds of its value, falling to 63.9. After a brief rally in May 1949 when the takeover of Shanghai appeared to be peaceful, it was downhill from there. The index fell to 30 by June 1950 when the Korean War began and declined to 22.7 by December 1953. By comparison, GFD’s Index of Hong Kong stocks declined from 38.8 in July 1947 to 37.3 in May 1948, fell to 32.2 in April 1949, but rose to 40.7 by December 1953 while the Shanghai stocks declined in value.
Figure 7. Four Shanghai Stocks in Hong Kong, 1947 to 1954
Jardine Matheson had the largest investment in China of any British firm with 20,000 employees in 1949, but the company found it increasingly difficult to operate in Communist China, and by 1954, it had either closed or sold all its operations in China at a substantial loss. Many Shanghai industrialists moved their cotton mills from Shanghai to Hong Kong. Hong Kong graduated from being an entrepôt for China to being a manufacturing center for the world.
The Demise of the Shanghai Stock Exchange
What happened to Chinese shares after the Pacific War ended in 1945? There was active trading in shares in Shanghai between 1937 when the Japanese seized Shanghai and December 1941 when the Japanese seized the International Settlements and Hong Kong, and trading on both the Shanghai and Hong Kong Stock Exchanges was shut down. The Japanese, the Kuomintang and the Communists all tried to squeeze money out of the Shanghai capitalists and at best, each of them tolerated the existence of the Shanghai Stock Exchange as something they could exploit for their own benefit. None of them encouraged it.
When the Shanghai Exchange closed during the Pacific War, trading moved into black markets until share trading was allowed to continue on the Shanghai exchange. However, inflation was the primary driver of stock prices between 1937 and 1949. As economic chaos engulfed Shanghai and the victory of the Communists over the Nationalists became inevitable in 1947, Shanghai investors began moving their capital out of Shanghai and into foreign shares in New York, London or Hong Kong which remained safe from the Communist victory.
The capitalization of shares in China fell from over $1 billion in 1925 to around $50 million in 1947. By contrast, when the St. Petersburg exchange closed in 1917, the capitalization of the exchange was at its highest level in history showing that investors in Russia had not anticipated the impact of the Russian Revolution and had not moved their money out of Russia in 1917. By contrast, Chinese investors lived through a decade of chaos and gradually moved their capital out of Shanghai, leaving the Shanghai Stock Exchange a shadow of its former self by the time it closed in 1949.
The four Shanghai shares we tracked underperformed the rest of the shares on the Hong Kong Stock Exchange, continuing to decline between 1950 and 1954 while Hong Kong stocks staged a rally. The Shanghai Stock Exchange died a slow death that began in 1937 and ended in 1949, but Shanghai industrialists found refuge in Hong Kong and, to the extent that they were able, moved their operations to Hong Kong which allowed free enterprise capitalism to reign in the following decades.
The current Shanghai Stock Exchange was founded on November 26, 1990, and began operating on December 19, 1990. Chinese companies began listing their shares on the Hong Kong Stock Exchange, issuing “H” shares which now represent over 70 percent of the market capitalization of the Hong Kong Stock Exchange. On July 1, 1997, Hong Kong was handed over to China. The Hong Kong Stock Exchange should be seen as a continuation of share trading in China between 1949 and 1990.
Now, let’s analyze China’s other stock exchange in Hong Kong.
Hong Kong – China’s Gateway to the World
During the First Opium War between 1839 and 1842, Britain occupied the island of Hong Kong on January 25, 1841. China was defeated in the war, and the Treaty of Nanking ceded control over Hong Kong to Britain, and the island became a crown colony of the British Empire. After the Second Opium War in 1860, the United Kingdom gained a perpetual lease over the Kowloon Peninsula. In 1898, the British negotiated a 99-year lease for the “New Territories.” Hong Kong was attacked by the Japanese on December 8, 1941, and the Japanese occupied Hong Kong until August 30, 1945. The lease of the New Territories expired on June 30, 1997, and in the Sino-British Joint Declaration of 1984, the British agreed to return not only the New Territories to China, but Kowloon and Hong Kong as well. Hong Kong was handed over to China on July 1, 1997. China agreed to guarantee Hong Kong’s economic and political system for 50 years after the handover, though recent political changes in Hong Kong have brought this commitment into question.
Hong Kong’s first Companies Ordinance was passed in 1865, and several companies incorporated in Hong Kong. The Hong Kong and China Gas Co. incorporated in 1862 and listed in London in 1865 while the Hong Kong and Shanghai Bank incorporated in 1868. Their shares traded in both London and Hong Kong. The prices of stocks were published in the China Mail newspaper beginning in 1870. By 1871, fifteen companies’ shares were trading in Hong Kong, primarily bank, utilities, insurance and shipping companies. Although the brokers had no building to trade shares in, 21 stockbrokers formed the Association of Stock Brokers in 1891 and began trading shares on a regular basis.
The Association of Stock Brokers was renamed the Hong Kong Stock Exchange in 1914. The Hong Kong Stockbrokers’ Association was established in 1921 and the Share and Real Estate Brokers’ Society in the 1920s. The Hong Kong Stock Exchange closed in December 1941 when Japan invaded Hong Kong, and the stock exchange reopened on February 28, 1947, though trading had begun in early 1946. The two exchanges merged to form a single exchange in 1947 because of the reduction in the number of brokers and share trading. The Far East Exchange was founded in 1969, the Kam Ngan Stock Exchange in 1971, and the Kowloon Stock Exchange in 1972. The four exchanges were unified into the Stock Exchange of Hong Kong Limited in 1980, and the four exchanges ceased business on March 27, 1986.
In the 1950s, Hong Kong transformed itself from being an entrepôt for China to becoming a center for industry and manufacturing. Milton Friedman championed Hong Kong as a model of free enterprise that the rest of the world should imitate. In August 1962, interest in stocks was great enough that the Far Eastern Economic Review introduced an index of Hong Kong stocks, and Q. W. Lee began calculating the Hang Seng index of 33 stocks in 1964. The Hang Seng Index was introduced on a daily basis in November 1969. Hong Kong and Singapore/Malaysia were added to the MSCI indices on December 1, 1972, and the MSCI Hong Kong Index was launched on December 29, 1972.
Between 1967 and 1999, the Hang Seng index grew at an annual rate of 19 percent. The market cap of Hong Kong stocks increased from less than $3 billion in 1967 to $600 billion in 1999 and peaked at $6.87 trillion in 2021 as Chinese companies were added to the Hong Kong Stock Exchange. Since the handover of Hong Kong to China, however, the Hong Kong stock market has underperformed the rest of the world, with the total return on stocks rising by only 1.5% per annum in real USD since 1997.
We have collected historical prices of shares that traded in Hong Kong between 1870 and 1961 from The China Mail, an English language newspaper that was published in Hong Kong between 1845 and 1974. From 1962 until the present, we used the Far Eastern Economic Review and Hang Seng Indices to bring data up to the present.
Until World War I, stock quotes were obtained from different brokers in Hong Kong for publication in the The China Mail, but when the Hong Kong Stock Exchange was established in 1914, and the Hong Kong Stockbrokers’ Association in 1921, The China Mail was able to get its quotes directly from the Stock Exchanges. Between 1881 and December 1917, The China Mail relied upon price lists submitted by Hong Kong brokers. The lists often included information on shares outstanding and/or authorized, par values, dividends, and yields. When The China Mail began relying upon official quotes from the Hong Kong Stock Exchange in December 1917, only price information was provided. The China Mail continued to provide quotes for British, Hong Kong and Chinese stocks until November 1950 when the stocks quoted fell from 85 to 30 and only companies denominated in Hong Kong Dollars were quoted from 1950 on.
Before World War II, shares traded in three currencies in Hong Kong. Hong Kong companies traded in Hong Kong Dollars, Chinese companies in Chinese Tael/Yuan and British multinationals in British Pounds. In 1899, 44 companies were listed in Hong Kong Dollars, 10 companies in British Pounds and 4 in Chinese Tael. So how should we put together an index of Chinese stocks that traded in Hong Kong given the multiplicity of currencies and shares that traded?
Comparing Hong Kong Stocks in Hong Kong Dollars, British Pounds and Chinese Tael
First, we calculated separate indices by currency, one for shares listed in Hong Kong Dollars, one for Chinese Tael, and one for British Pounds. Of course, we know that after the Communists took over China, companies from China ceased to trade in Hong Kong and became worthless after 1950. In Figure 8, the performance of shares trading in Hong Kong Dollars (black), British Pounds (green) and Chinese Tael (red) is provided. All prices have been converted into Hong Kong Dollars so there is a common currency to compare all three indices. The multinationals that traded in British Pounds performed the best, probably because they had more opportunities to profit from activities outside of China. Hong Kong Dollar stocks (black) underperformed relative to British multinationals (green), and the actual underperformance was greater because the Hong Kong Dollar was tied to silver and the British Pound was tied to gold. Consequently, the Hong Kong Dollar depreciated relative to the British Pound between 1870 and 1914. Chinese stocks (red) provided a similar performance relative to Hong Kong Dollar stocks until 1949 when Chinese shares lost their value.
Figure 8. Comparison of Hong Kong stocks in HKD, CNT and GBP, 1870 to 1961
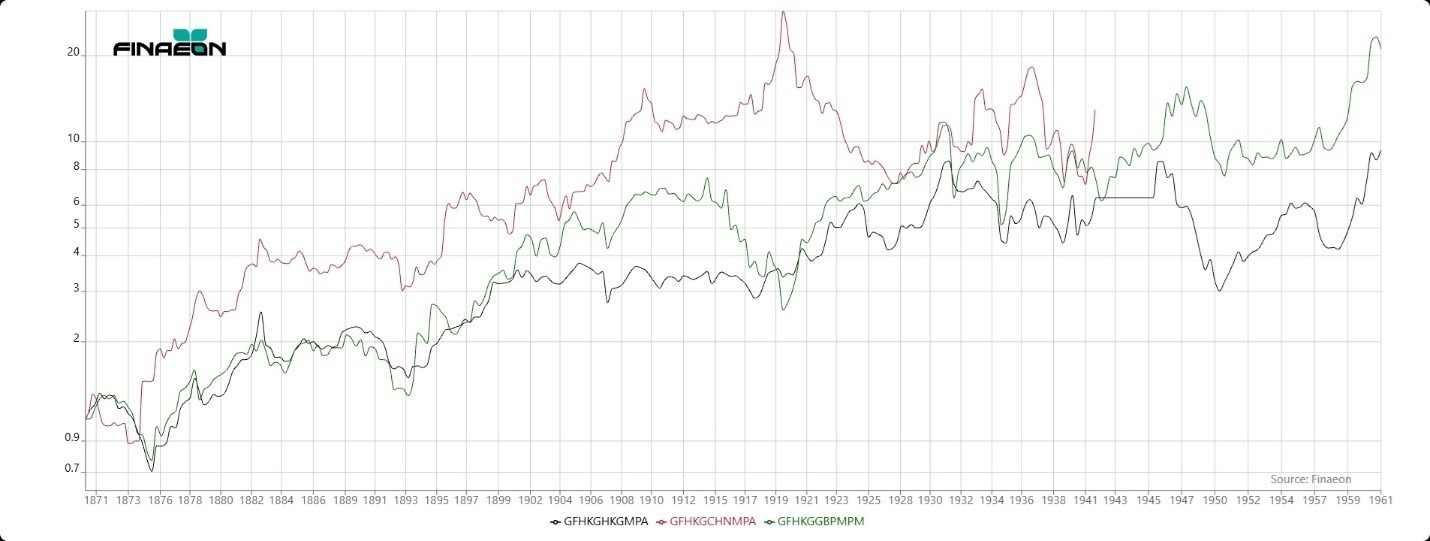
What is really fascinating about the comparison of the stocks in the three currencies is how dissimilar the returns are. You would think that since all the stocks were listed and traded in Hong Kong, there would be a strong correlation between the performance of each set of stocks, but that is not the case. In fact, there should be little surprise that multinational stocks, Hong Kong stocks and Shanghai stocks performed differently.
Shanghai was 900 miles from Hong Kong and stocks listed in Chinese Tael reflected a completely different economy from that which existed in Hong Kong. There were two dozen shares in Hong Kong that traded in Chinese Tael. These were primarily companies that were originally listed on the Shanghai Stock Exchange and cross-listed on the Hong Kong Stock Exchange. This included several shipping companies (Shanghai Tug & Lighter Co.), clothing companies (Shanghai Cotton Manufacturing Co.) and several rubber and mining companies (Chinese Engineering & Mining Co.).
There were 32 companies from Shanghai that traded in Chinese Tael that were also listed in Hong Kong. There were 31 shares from Hong Kong that traded in Hong Kong Dollars that were also listed in Shanghai. There were 10 shares that traded in both Hong Kong and Shanghai and were denominated in British Pounds. A list of these shares is found in Appendix Table 1. Because there were 69 shares that cross-listed between Hong Kong and Shanghai, it is difficult to determine what a “Chinese” share was. The stocks with the largest market capitalization and most frequently traded were also the stocks that listed in both Hong Kong and Shanghai.
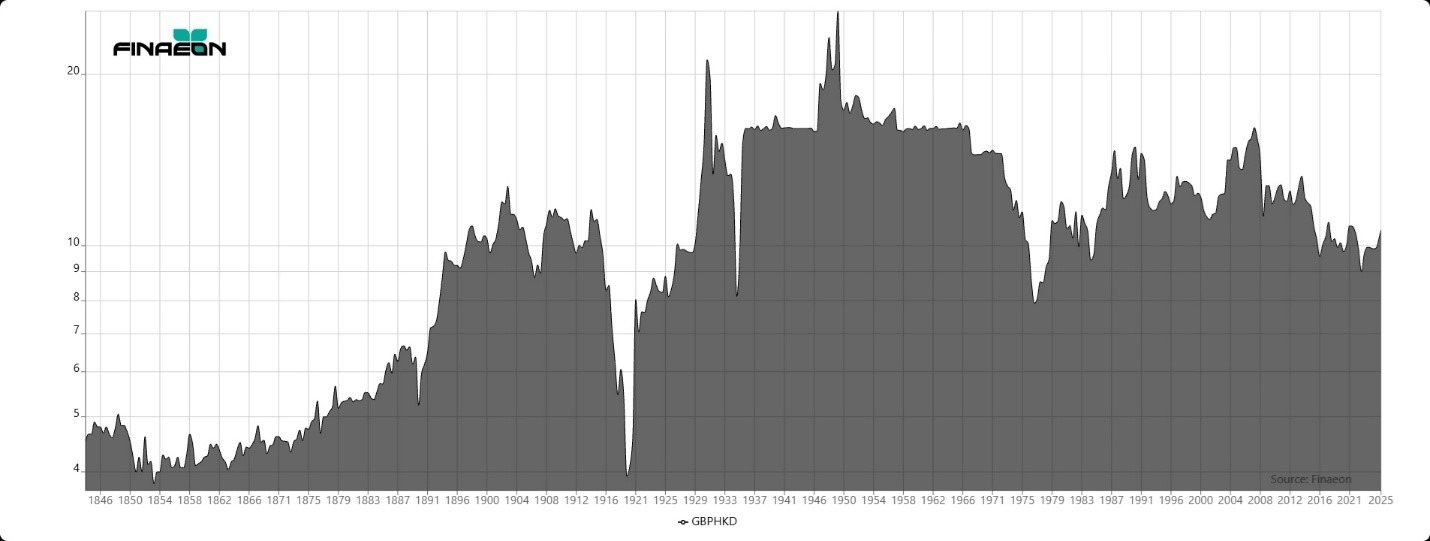
The stocks that traded in British Pounds were multinationals, so their performance was more dependent on factors outside of Hong Kong than in Hong Kong. The performance of the largest stock by capitalization, Shell Transport and Trading Co., was primarily dependent on the oil market and the performance of the Hong Kong and Shanghai Bank Corp. and the Chartered Bank were dependent upon financial markets. The largest group by capitalization were about 20 companies denominated in British Pounds and based in London, such as the Hong Kong & Shanghai Banking Corp., Shell Transport & Trading Co., Ltd. and the Indo-China Steam Navigation Co. All these shares were traded in London and were more liquid in London, and by their sheer size, they represented the majority of capitalization on the Hong Kong Stock Exchange. The Hong Kong Dollar-British Pound exchange rate is illustrated in Figure 2.
Figure 9. Hong Kong Dollars per British Pound, 1844 to 2024
The remaining 120 companies on the Hong Kong Exchange were all local firms that traded in Hong Kong Dollars and provided services in Hong Kong. Companies were evenly distributed across the spectrum of sectors. Stocks listed in Hong Kong Dollars were local companies that provided shipping, insurance, utilities, stores and other services in Hong Kong, Macao and Canton (Guangzhou).
Because Hong Kong was a British colony, Hong Kong government bonds were backed by the British government. Yields remained between 3% and 4% between 1890 and 1960, with the exception of the inflationary period during World War I. Unlike China, Hong Kong never defaulted on its bonds because of the backing of the British government. Hong Kong government bonds traded in both Hong Kong and in London.
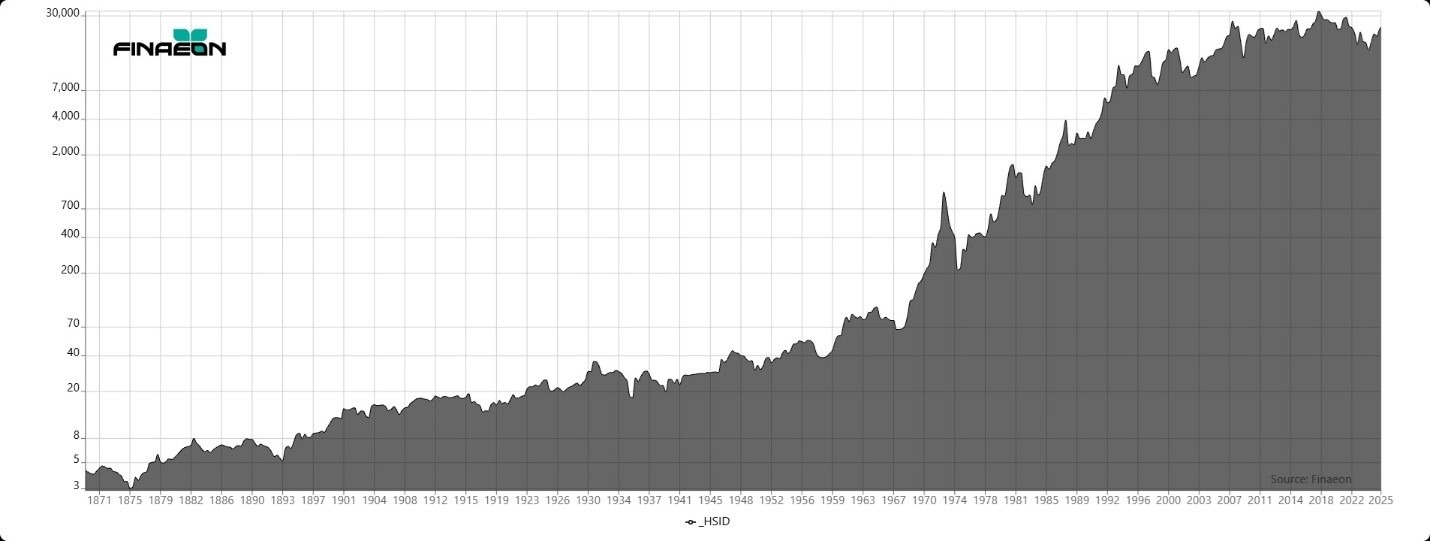
The index of all shares that traded in Hong Kong, converted into Hong Kong Dollars is illustrated in Figure 10. As can be seen, Hong Kong stocks followed a steady appreciation over time, though as we remarked, before World War II, two-thirds of the market cap was dependent upon three companies, Shell Trading, the Chartered Bank and the Hong Kong and Shanghai Bank.
Figure 10. Hong Kong Stock Market Index, 1868 to 2025
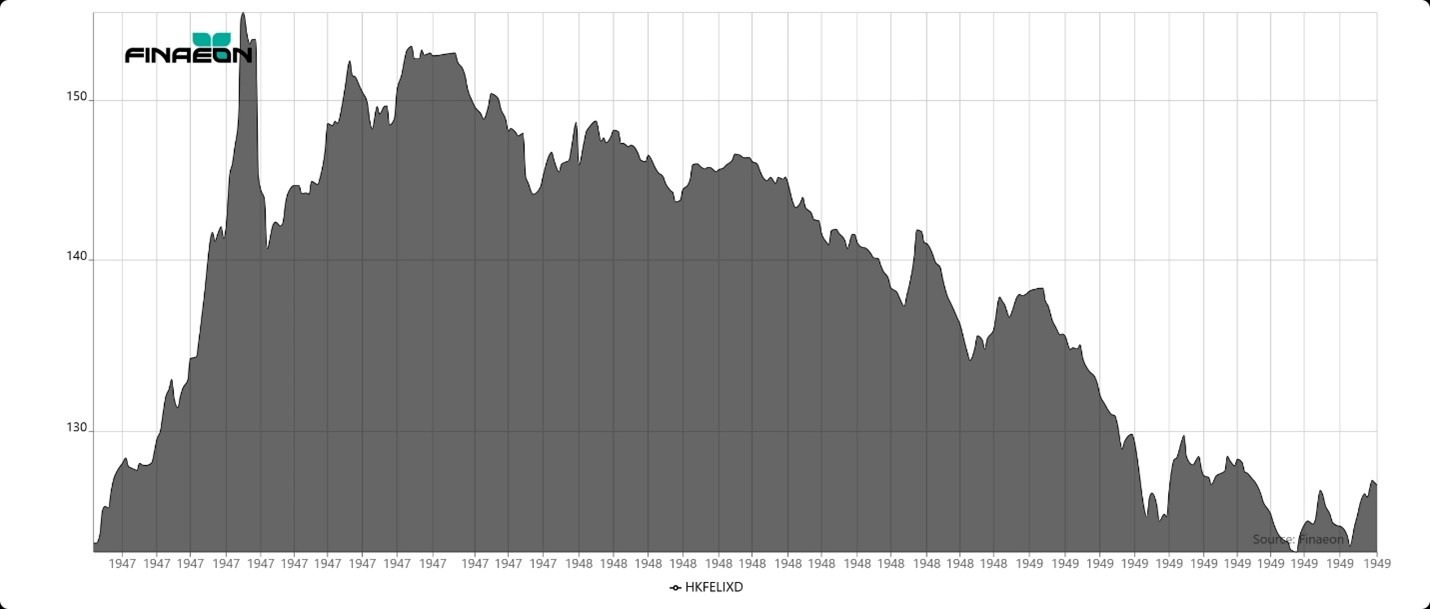
The stockbrokers at Felix-Ellis calculated a daily stock market index of 12 leading stocks in Hong Kong which shows how the market reacted to the gradual defeat of the Kuomintang by the Communists. The index was calculated between January 1947 and November 1949 and published in the Far Eastern Economic Review. As Figure 5 shows, the index slid continually from September 1947 to the end of 1949. The Korean War began on June 25, 1950, and UN forces counterattacked on September 15, 1950. On October 19, 1950, the Chinese People’s Volunteer Army crossed into Korea, recapturing Seoul in January 1951, though the UN counter-offensive recaptured Seoul in March 1951. Share prices in Hong Kong continued to slide until December 1950 when they reached their bottom and began a rally that lasted for the rest of the decade.
Figure 11. Felix-Ellis Index of 12 Leading Hong Kong Stocks, 1947 to 1949
Bull and Bear Markets in Hong Kong
A history of the bull and bear markets in Hong Kong is provided in Table 5. There have been 24 bear markets in Hong Kong since 1870. The first occurred in 1871 soon after the speculative bubble that followed the introduction of share trading in Hong Kong burst. The second occurred after a credit crisis in 1883 which was followed by a banking crisis in Hong Kong that occurred in 1890 when financial embarrassment at the Hong Kong and Shanghai Bank drove prices down. The decline in the price of silver in the 1890s negatively impacted Hong Kong’s economy and two outbreaks of plague in the 1890s reduced the population; however, Hong Kong added the New Territories in 1898, increasing its land area from 32 to 390 square miles.
Table 5. Bull and Bear Markets in Hong Kong, 1870 to 2025
| Bottom | Bear Decline | Top | Bull Increase |
| 11/31/1871 | |||
| 6/30/1875 | -36.54 | 4/30/1883 | 192.8 |
| 08/31/1893 | -41.86 | 3/31/1901 | 197.32 |
| 1/31/1904 | -20.34 | 3/31/1916 | 61.22 |
| 9/30/1917 | -30.78 | 2/28/1931 | 182.04 |
| 9/30/1935 | -53.23 | 6/30/1937 | 74.16 |
| 8/31/1939 | -36.72 | 9/30/1947 | 127.37 |
| 8/31/1950 | -33.49 | 7/31/1955 | 91.68 |
| 11/30/1958 | -31.82 | 1/31/1965 | 169.41 |
| 8/31/1967 | -43.39 | 3/9/1973 | 2928.42 |
| 12/10/1974 | -91.54 | 9/4/1978 | 371.51 |
| 11/20/1978 | -33.82 | 7/17/1981 | 286.42 |
| 12/2/1982 | -62.64 | 7/21/1983 | 63.04 |
| 10/4/1983 | -37.42 | 10/1/1987 | 472.37 |
| 12/7/1987 | -52.02 | 5/15/1989 | 74.66 |
| 6/5/1989 | -36.74 | 1/4/1994 | 482.78 |
| 1/23/1995 | -42.89 | 8/14/1997 | 136.77 |
| 8/13/1998 | -59.63 | 3/28/2000 | 174.78 |
| 4/25/2003 | -54.05 | 10/30/2007 | 276.24 |
| 10/27/2008 | -65.18 | 11/8/2010 | 126.62 |
| 10/4/2011 | -34.91 | 4/28/2015 | 75.03 |
| 2/12/2016 | -35.59 | 1/26/2018 | 80.98 |
| 3/19/2020 | -34.56 | 2/17/2021 | 43.27 |
| 10/31/2022 | -52.75 | 1/27/2023 | 54.48 |
| 1/22/2024 | -34.06 |
The Russo-Japanese War of 1904 diverted ships to ports other than Hong Kong, but the boom in rubber shares between 1908 and 1909 increased interest in all shares. The 1911 Chinese Revolution brought the Qing dynasty to an end, but this had little impact on Hong Kong. Business picked up during World War I, aiding the stock market. The Association of Stockbrokers had no Chinese members, so in 1921, an all-Chinese Hong Kong Stockbrokers Association was formed. Hong Kong’s bear markets were shallow between 1900 and 1930 because the local economy generally did well. The start of the Great Depression led to a bear market in which shares lost over half of their value between 1931 and 1935. Strikes at cotton mills and boycotts of British goods by the Chinese in the 1930s reduced Hong Kong’s exports to China from $432 million in 1921 to $90 million by 1939. This was followed by Japan’s invasion of China in 1937, the start of World War II in Europe in 1939, and Japan’s occupation of Hong Kong in December 1941. All these issues kept stock prices from rising during the 1930s.
The two Hong Kong Stock Exchanges merged into one and the exchange reopened in February 1947. After 1950, the Hong Kong market represented only companies that had operations in Hong Kong and the Pearl River Delta. The British left Shanghai after the Communists took over China and moved some of their cotton mills and other businesses to Hong Kong. After the Communists took over China, over a million southern Chinese migrated to Hong Kong, bringing their business skills with them. There was a gradual appreciation in the price of Hong Kong shares throughout the 1950s as the colony recovered from the war. Hong Kong was discovered as a free trade entrepôt in the 1960s that could take advantage of cheap, but efficient labor, to export goods to the United States and the rest of the world. Milton Friedman discovered Hong Kong in the mid-1950s, and he promoted its economy, an enterprise that soon paid off.
In 1962, interest in stocks was great enough that the Far Eastern Economic Review introduced an index of Hong Kong stocks, and Q. W. Lee began calculating the Hang Seng index of 33 stocks in 1964. Hong Kong benefited from American soldiers visiting during the Vietnam war. The Far East Exchange was opened in 1969, the Kam Ngan Stock Exchange in March 1971, and the Kowloon Stock Exchange in January 1972. The four exchanges merged to form the Stock Exchange of Hong Kong on March 27, 1986.
The most spectacular bull market in Hong Kong shares occurred between 1967 and 1973 when the market rallied almost 3000 percent. The Hong Kong bubble burst in March 1973 and the Hong Kong market declined by over 91% between March 1973 and December 1974. The Hang Seng index once again reached its 1973 market peak in 1981. The Hong Kong market continued to rally during the 1990s and 2000s as Chinese stocks began listing on the Hong Kong Stock Exchange after the opening of the Shanghai and Shenzhen exchanges in 1990. Between 1974 and 2007, the Hang Seng Index rose from 150 to 31,638, increasing over 200-fold. Today, over 70% of the capitalization of the Hong Kong Stock Exchange are mainland Chinese shares and the Hang Seng Index reflects the behavior of mainland China stocks more than Hong Kong shares.
Returns to stocks, bonds and bills in Hong Kong in real USD are provided in Table 6 along with the risk premium between stocks and bonds and between stocks and bills. Between 1869 and 2024, stocks returned 4.64% and cash lost 0.54% producing an equity-bill premium of 5.21%. Bond yields averaged between 3% and 4%. Stock returns between 1870 and 1929 were consistently around 3%, certainly not spectacular, but reliable.
Hong Kong enjoyed a 50-year miracle between the reopening of the HKSE in 1947 and the handover to China in 1997 when shares returned 10.2% per annum in real USD, the highest returns during those years of any stock market in the world. The Hong Kong stock market provided spectacular, double-digit returns in the 1960s, 1970s and 1990s. Hong Kong provided a return of over 10% per annum in real USD in the 1900s, but so far, during the 21st century, it has only provided a return of 1.5%. Since 1997, returns have been mediocre. The only decades which provided a negative return in Hong Kong were the 1940s and the present decade, the 2020s; however, one can hope that by 2029, returns will be positive. Unfortunately, bond data is not available throughout Hong Kong’s history, but the returns to cash are.
Table 6. Returns to Stocks, Bonds and Bills in Real USD in Hong Kong, 1869 to 2024
| Stock Return | Bond Return | Bill Return | Stock-Bond | Stock-Bill | |
| Real USD | Real USD | Real USD | Premium | Premium | |
| By Decade | |||||
| 1869-1879 | 6.03 | 1.63 | 4.33 | ||
| 1879-1889 | 5.71 | 1.14 | 4.52 | ||
| 1889-1899 | 1.35 | -2.82 | -2.78 | 4.29 | 4.25 |
| 1899-1909 | 2.91 | 0.55 | -0.52 | 2.35 | 3.45 |
| 1909-1919 | 3.1 | 8.75 | 4.42 | -5.2 | -1.26 |
| 1919-1929 | 1.21 | -5.47 | -2.88 | 7.07 | 4.21 |
| 1929-1939 | -1 | 1.22 | -1.75 | -2.19 | 0.76 |
| 1939-1949 | -9.71 | -5.92 | -8.86 | -4.03 | -0.93 |
| 1949-1959 | 5.27 | 2.13 | 3.07 | ||
| 1959-1969 | 12.83 | 2.39 | 10.2 | ||
| 1969-1979 | 18.11 | -0.05 | 18.17 | ||
| 1979-1989 | 6.35 | -2.55 | 9.13 | ||
| 1989-1999 | 20.8 | 9 | 2.48 | 10.83 | 17.88 |
| 1999-2009 | 3.39 | 3.44 | 0.04 | -0.05 | 3.35 |
| 2009-2019 | 4.4 | 0.67 | -1.17 | 3.71 | 5.64 |
| By Period | |||||
| 1914-1981 | 4.31 | -1.14 | 5.51 | ||
| 1899-1999 | 10.43 | 3.93 | 6.25 | ||
| 1873-1896 | 3.59 | -0.16 | 3.76 | ||
| 1896-1914 | 3.69 | 1.73 | -0.12 | 1.93 | 3.81 |
| 1914-1929 | 2.57 | 0.23 | 0.4 | 2.33 | 2.16 |
| 1929-1949 | -5.45 | -2.42 | -5.47 | -3.11 | 0.02 |
| 1949-1968 | 6.17 | 2.02 | 4.07 | ||
| 1968-1981 | 18.35 | -1.26 | 19.86 | ||
| 1981-1999 | 13.78 | 0.74 | 12.94 | ||
| 1999-2019 | 3.89 | 2.05 | -0.57 | 1.8 | 4.49 |
| 2019-2024 | -7.58 | -5.14 | -1.98 | -2.57 | -5.71 |
| To Present | |||||
| 1873-2024 | 4.73 | -0.6 | 5.36 | ||
| 1914-2024 | 5.15 | -4.03 | -0.77 | 9.57 | 5.97 |
| 1945-2024 | 8.25 | -5.02 | 0.27 | 13.97 | 7.96 |
| 1981-2024 | 6.46 | -0.19 | 6.66 | ||
| 1899-2024 | 4.79 | -0.64 | 5.46 | ||
| 1949-2024 | 8.7 | 0.29 | 8.39 | ||
| 1969-2024 | 8.6 | -0.42 | 9.06 | ||
| 1999-2024 | 1.49 | 0.57 | -0.85 | 0.91 | 2.36 |
Conclusion
Today, China has the second largest economy in the world, and the second largest stock market in the world after the United States. The Chinese stock market remained small relative to its potential before World War II. The stock market was limited to the international settlements in Shanghai and Hong Kong. Japan built the South Manchurian Railway in occupied Manchuria, but most other railroads were joint ventures with foreign governments that were funded by bonds, not shares. Outside the International Settlements, there was never much of an interest in the stock market in China. The stock market funded local companies run by foreigners, companies tied to finance and exports, and speculation in Malaysian plantations. The stock market was never used as a resource to develop the Chinese economy until the 1990s. The pre-war stock market reached its peak capitalization in 1925, and shrank for the next 25 years as Depression, war, corruption, inflation, warlords, and other problems beset the Chinese economy. Neither the Qing Dynasty, the Kuomintang or the Communists saw the stock market as a source of modernization of the Chinese economy. Most of the investment was driven by foreigners who lived in the international settlements. Native Chinese may have participated in speculating in stocks, but the stock market was never seen as a way to modernize the economy in the way that the Japanese took advantage of the opportunity. It is significant that the largest corporation in China, the South Manchurian Railway, was a Japanese company.
By the time the Shanghai Stock Exchange was closed in 1949, the Shanghai exchange was a shadow of its former self. The capitalization of Chinese stocks had fallen from over $1 billion in 1925 to around $50 million by 1947 reflecting the severe outflow of capital that had occurred in Shanghai during the decade of chaos that preceded the closure of the exchange. The Malaysian rubber plantation stocks were often the most active shares in Shanghai. Twelve years of war with Japan and civil war between the Kuomintang and the Communists prevented China from developing. Chinese and British citizens in southern China could read the writing on the wall and began moving their capital and their industry to Hong Kong as the Communists conquered Shanghai. Shanghai investors had several warnings that the exchange’s days were numbered. The exchange had been closed and reopened several times under the Japanese and the Kuomintang. Speculators might have continued to trade shares, but investors moved their money out of Shanghai and into Hong Kong, London, New York or Tokyo. Hong Kong became a bastion of free enterprise and developed its economy to export goods to the rest of the world. Hong Kong enjoyed a fifty-year miracle of rapid growth between 1947 and 1997 during which stock prices increased by 10.2% on an annual basis in real USD. Between 1947 and 1997, Hong Kong had the highest stock market returns of any country in the world. Since returning to China, Hong Kong’s stock market has only grown by 1.5% per annum in real USD.
China reintroduced stock trading in 1990 when exchanges in Shanghai and Shenzhen were opened. Chinese companies issued H-shares in Hong Kong to access capital from international capital markets. Many Chinese companies also listed shares in New York and on other Western exchanges to increase their access to international capital. After providing dramatic returns during the first two years of its existence, returns to shareholders in Shanghai have leveled off. Since hitting its peak in 1992, shares have little more than doubled in price during the past 32 years despite dramatic swings in prices. As Chinese shares have come to dominate the Hong Kong Exchange, returns in Hong Kong reflect returns in China more than they do returns to Hong Kong shares.
In a way, the Shanghai and Hong Kong exchanges have come full circle. Before World War II, Shanghai and Hong Kong cross-listed shares on each other’s exchanges. When the Shanghai exchange was closed after World War II, shares moved from Shanghai to Hong Kong. Now that China has reemerged, Hong Kong’s capitalization includes more Chinese shares than Hong Kong shares. During the 1940s, Shanghai investors took advantage of the opportunities they were provided to move their capital out of Shanghai and into Hong Kong or other countries. Speculators who traded in Shanghai after World War II ended, lost their capital, but investors who moved their money to Hong Kong were able to take advantage of the 50-year Hong Kong Miracle and enjoy the highest returns of any stock market in the world during those 50 years.
Appendix Table 1. Companies Cross-Listing in Shanghai and Hong Kong
| Company | Currency | Start Date |
| Chinese Engineering & Mining Co., Ltd. | CNT | 1903 |
| Co-operative Cargo Boat Company, Ltd. | CNT | 1882 |
| Ewo Cotton Spinning & Weaving Co., Ltd. | CNT | 1903 |
| Far Eastern Insurance Co., Ltd. | CNT | 1917 |
| International Cotton Manufacturing Co., Ltd. | CNT | 1903 |
| Kung Yik Cotton Spinning and Weaving Co., Ltd. | CNT | 1911 |
| Langkat Rubber Estate | CNT | 1930 |
| Lao Kung Mow Cotton Spinning and Weaving Company Limited | CNT | 1903 |
| Maatschappij Tot Mijn, Bosh-en Laudbouwex - Ploitatie in Langkat Rubber Estates | CNT | 1903 |
| Metropolitan Land & Building Co., Ltd. | CNT | 1933 |
| North-China Insurance Co | CNT | 1870 |
| Oriental Cotton, Spinning and Weaving Co Ltd | CNT | 1916 |
| Perak Sugar Cultivation Co Ltd | CNT | 1883 |
| Perak Tin Mining & Smelting Co. | HKD | 1883 |
| Shanghai & Hongkew Wharf Co Ltd. | CNT | 1872 |
| Shanghai Cargo Boat Co. | CNT | 1882 |
| Shanghai Cotton Manufacturing Co. | CNT | 1909 |
| Shanghai Dock & Engineering Co., Ld | CNT | 1906 |
| Shanghai Exploration & Development Co., Ld | CNT | 1919 |
| Shanghai Gas Co. | CNT | 1870 |
| Shanghai Land Investment Co Ltd | CNT | 1903 |
| Shanghai Loan & Investment Co. Ltd. | CNT | 1919 |
| Shanghai Tug & Lighter Co Ltd | CNT | 1870 |
| Shanghai Tug & Lighter Co Preferred | CNT | 1903 |
| Shanghai Tug Boat Association | CNT | 1878 |
| Shanghai Waterworks Co Ltd | CNT | 1881 |
| Soy Chee Cotton Spin. Co. Ld | CNT | 1903 |
| Taku Tug and Lighter Co | CNT | 1887 |
| The Astor House Hotel Company, Ltd. (Shanghai) | CNT | 1901 |
| Wei-hai-wei Land & B.Co., Ld | CNT | 1903 |
| Yangtsze Insurance Assocation | CNT | 1870 |
| Zoong Sing Cotton Mills, Ld | CNT | 1925 |
| Bell's Asbestos Eastern Agency, Ltd. | GBP | 1895 |
| Chartered Bank of India, Australia, and China, Ltd. (The) | GBP | 1870 |
| Hongkong & Shanghai Banking Corporation | GBP | 1870 |
| Indo-China Steam Navigation Co. Ltd. Deferred Ordinary | GBP | 1909 |
| Indo-China Steam Navigation Co. Ltd. Preferred | GBP | 1909 |
| National Bank of China, Ltd. A Shares | GBP | 1896 |
| Shell Transport & Trading Co Ltd | GBP | 1901 |
| The Bank of China, Japan and the Straits Ltd. | GBP | 1898 |
| The Bank of China, Japan and the Straits Ltd. (Deferred) | GBP | 1892 |
| The China Shippers' Mutual Steam Navigation Co., Ltd. | GBP | 1887 |
| Canton Insurance Office, Ltd. | HKD | 1882 |
| China Fire Insurance Company, Ltd. | HKD | 1870 |
| China Sugar Refinery Co., Ltd. | HKD | 1894 |
| China Traders' Insurance Co., Ltd. | HKD | 1870 |
| Chinese Insurance Co.,Limited | HKD | 1871 |
| Douglas Steamship Company, Ltd. | HKD | 1894 |
| Green Island Cement Company Limited | HKD | 1901 |
| Hongkong Cotton Spinning, Weaving and Dyeing Co., Ltd. | HKD | 1897 |
| Hongkong Electric Company, Limited | HKD | 1894 |
| Hongkong Fire Insurance Company, Ltd. | HKD | 1870 |
| Hongkong Land Investment & Agency Co., Ltd. | HKD | 1894 |
| Hongkong & Whampoa Dock Company Limited | HKD | 1894 |
| Hongkong, Canton and Macao Steamboat Co., Ltd. | HKD | 1891 |
| Humphreys Estate and Finance Co., Ltd. | HKD | 1895 |
| International Investments Co., Ltd. | HKD | 1930 |
| Jelebu Mining and Trading Company, Limited | HKD | 1894 |
| Kowloon Land & Building Co., Ltd. | HKD | 1895 |
| Lane Crawford (Hongkong) Ltd. | HKD | 1905 |
| Luzon Sugar Refining Company, Ltd. | HKD | 1894 |
| Malabon Sugar Co., Ltd. | HKD | 1929 |
| Punjom Mining & Trading Co Ltd | HKD | 1894 |
| Punjom Mining & Trading Co Ltd Preferred | HKD | 1894 |
| Raub Australian Gold Mining Co Ltd | HKD | 1894 |
| Robinson Piano Co., Ld | HKD | 1901 |
| Star Ferry Co., Ld | HKD | 1929 |
| Straits Insurance Co., Limited | HKD | 1888 |
| The A.S. Watson Group, Ltd. | HKD | 1892 |
| The Hongkong and China Gas Company Limited | HKD | 1870 |
| The Hongkong and Kowloon Wharf and Godown Company, Limited | HKD | 1887 |
| The HongKong and Shanghai Hotels, Ltd. | HKD | 1900 |
| Union Insurance Society of Canton Ltd | HKD | 1870 |
| American-Oriental Finance Corp. Fed., Inc. | USD | 1930 |
Bibliography
Periodicals
China Mail, 1845-1974
Le Journal de Shanghai, 1927-1940
The North China Herald, 1865-1941
Books and Articles
Arakie, David. Guide to Shanghai Rubber Companies. Shanghai: Capital & Trade, 1925.
Chen, Zhiwu, “Capital Freedom in China as Viewed from the Evolution of the Stock Market,” Cato Journal, Vol. 33, No. 3 (Fall 2013): 587-601
Fan, Wenzhong, “Construction Methods for the Shanghai Stock Exchange Indexes, 1870-1940,” Yale International Center for Finance, manuscript.
Goetzmann, William N., Andrey D. Ukhov, and Ning Zhu. “China and the World Financial Markets 1870–1939: Modern Lessons from Historical Globalization.” The Economic History Review 60, no. 2 (May 2007): 267–312.
Goetzmann, William N. and Elisabeth Koll, “The History of Corporate Ownership in China: State Patronage, Company Legislation, and the Issue of Control,” NBER Working Paper, November 2005.
Huen, Chung Yuen Ian, “The Rubber Stock Crisis in 1910 Shanghai: were the listed companies fraudulent? A look into the financials of Tebong and Tapioca Estates after the Crisis,” manuscript.
Ji, Chen and Steve Johnson, “Emerging Stock Markets in the People’s Republic of China,” Financial History, Spring 2003, Pp. 28-31.
Liu, Jiajia, “Financial Capitalism on the Periphery: The Rubber Boom and Bust in Shanghai,” The Graduate Institute of Geneva, 2022.
Morriss, H. E. and C. R. McGuire, China Stock and Share Handbook, Shanghai: North-China Daily News and Herald, Ltd., 1912-1930
Stock Exchange of Hong Kong, Shares in Hong Kong, Hong Kong: Stock Exchange of Hong Kong, 1991
Thomas, William A., “An Intra-Empire Capital Transfer: The Shanghai Rubber Company Boom 1909-1912,” Modern Asian Studies 32, No. 3 (July 1998): 739-760.
Thomas, William A., Western Capitalism in China: A History of the Shanghai Stock Exchange, Aldershot, Burlington: Ashgate 2001.
McElderry, Andrea. “Shanghai Securities Exchanges: Past and Present.” Asian Business History Occasional Paper Series, 2001, 1–27.


