Michelle Suzanne and Dean Jacobsen, Finaeon
At Finaeon, we understand the temptation to react quickly in the face of uncertainty—especially as headlines around tariffs, inflation, and political unrest dominate the news reports. As a company built on the principles of complete, unabridged data – one thing remains certain. Centuries of financial and economic data indicate the dips and peaks due to political tension and release of “bad news” eventually recover. And, yes, we’ve seen this before. History demands one thing: staying the course often proves to be the most effective investment strategy.
The 1979 Oil Crisis: Short-Term Panic, Long-Term Perspective
Consider the late 1970s. Under President Jimmy Carter, the U.S. faced the second major oil shock due to geopolitical instability in the Middle East. Oil prices surged sharply—more than tripled in less than a decade—leading to high inflation, tighter monetary policy, and a dip in consumer confidence.
Graph 1: Crude Oil Prices vs. U.S. Inflation, S&P 500, and DJIA (1970–1990)
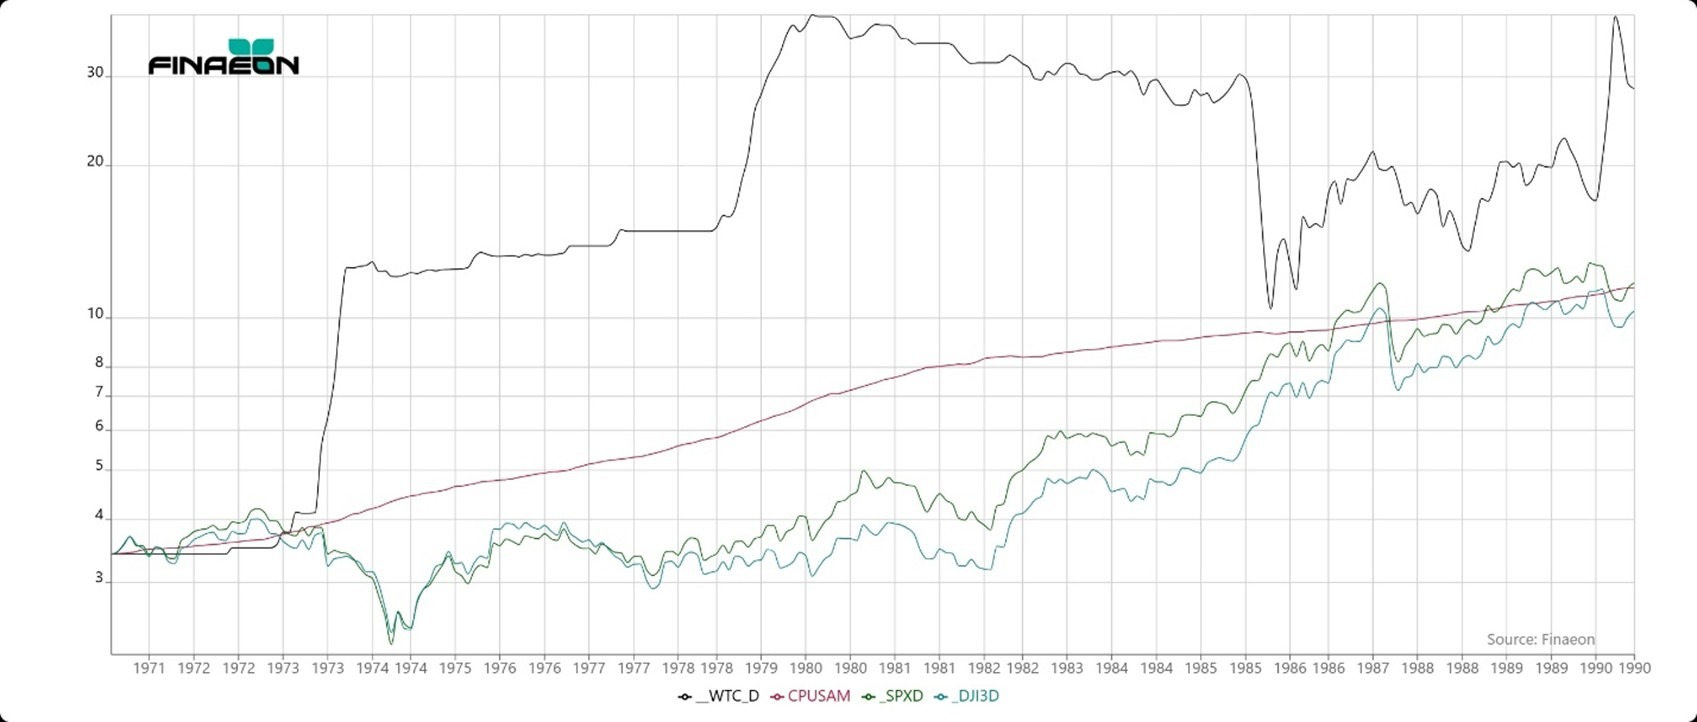
__WTC_D - West Texas Intermediate Oil Price (US$/Barrel) (with GFD Extension)
CPUSAM - United States BLS Consumer Price Index Inflation Rate NSA (with GFD Extension)
_SPXD - S&P 500 Composite Price Index (with GFD extension)
_DJI3D - Dow Jones Industrials Average (Actual) (with GFD Extension)
Despite the severity of the oil price spike (black line) and sustained inflation (red line), the equity markets (green and blue lines) remained surprisingly resilient. The S&P 500 and DJIA showed only moderate pullbacks and resumed upward momentum by the early 1980s. In fact, examine the huge upward influx in oil prices, and through this dynamic surge, inflation increased at a steady pace, and while not ideal it was not reacting in a parity with the surge in oil prices. Now examine the major markets, they did plunge initially in the mid-1970s when the first large oil spike occurred. This was anticipated, and while investors lost millions, the major markets did recover most of their losses within three years. Investors who stayed invested through this period saw strong cumulative gains by the mid-to-late 1980s.
Volatility in Context: The Great Depression and Market Recovery
While short-term volatility is nothing new, it’s often misunderstood. During the Great Depression, the market experienced some of its worst losses—but even then, equities began to recover in just a few years.
Graph 2: S&P 500 and DJIA (Inflation Adjusted), 1929–1949
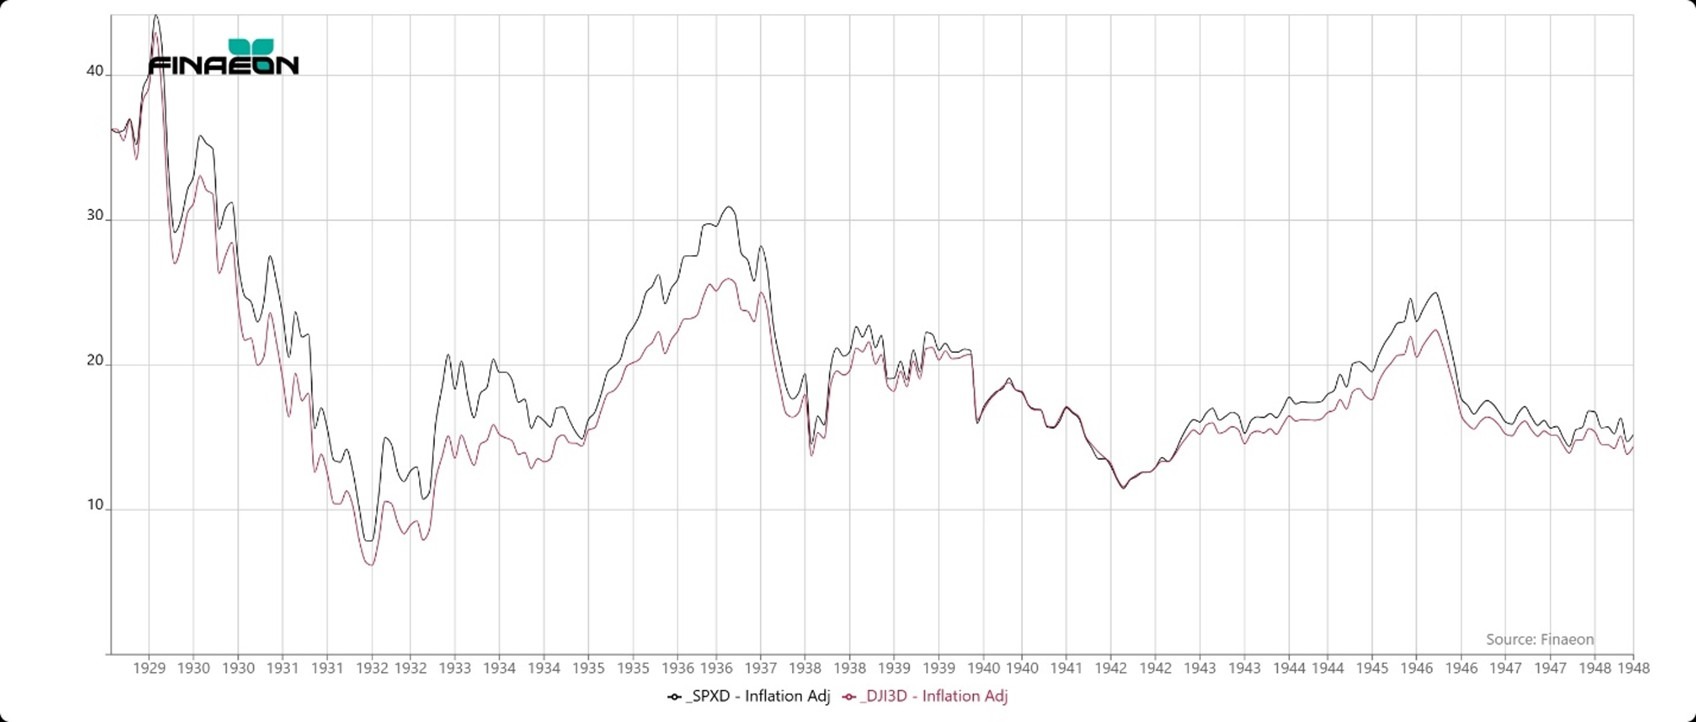
_SPXD - S&P 500 Composite Price Index (with GFD extension) – Inflation Adjusted
DJI3D - Dow Jones Industrials Average (Actual) (with GFD Extension) – Inflation Adjusted
This graph shows both indices (adjusted for inflation), capturing the initial crash and the waves of recovery during the 1930s and 1940s. Despite prolonged economic stress and global conflict, investors who remained invested through the downturn and recovery phases saw restored—and even growing—value over time.
The Bigger Picture: Long-Term Growth Over a Century
To put all of this in perspective, let’s step back and look at the broader historical performance of equity markets. Over nearly a century of economic upheaval—wars, recessions, oil shocks, tariff wars, inflation cycles—the U.S. market has demonstrated remarkable resilience.
Graph 3: Market Performance Since 1929 (Including GFD US 100 Index)
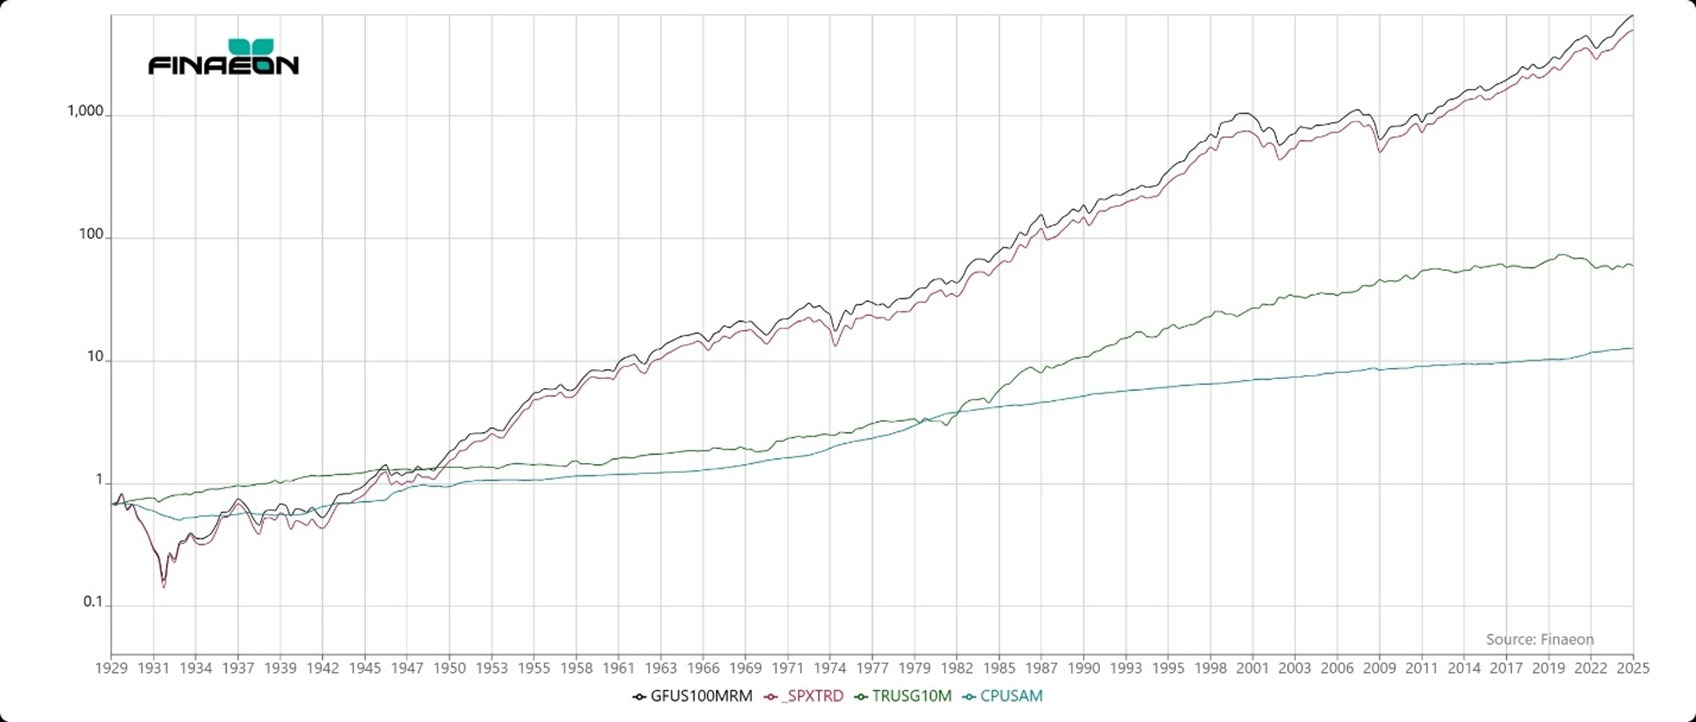
GFUS100MRM - GFD Indices USA Top 100 Total Return Index
_SPXTRD - S&P 500 Total Return Index (with GFD extension)
TRUSG10M - GFD Indices USA 10-year Government Bond Total Return Index
CPUSAM - United States BLS Consumer Price Index Inflation Rate NSA (with GFD Extension)
This long-range graph illustrates that the GFD US 100 Index (black line) has outperformed the S&P 500 (red line), with both showing powerful long-term upward trends. Even amid policy changes, oil embargos, and rate cycles, disciplined investors who stayed invested captured substantial long-term returns.
The Takeaway: Stay the Course
History doesn’t just suggest patience—it rewards it. Pulling back or attempting to time the market during volatile periods often results in missed opportunities. As this data shows, markets can and do recover—even after the most significant shocks.
Trying to time the market is like trying to catch a falling knife—risky, imprecise, and often painful.
Staying invested with a long-term view is not only safer but far more rewarding.
At Finaeon, our mission is to deliver the historical insights that create alpha investment decisions. Let the past be your guide: stay committed, stay invested—and trust in the long arc of growth.


